Early stage teams are very good at feeling busy. They are not always as good at knowing whether that busyness is moving the company forward.
A week can contain dozens of closed tasks, product updates, sales calls, campaign launches, and AI generated outputs while the most important business problem remains unchanged. That is why startup productivity is difficult to measure. The easiest things to count are often the least useful things to manage.
For an AI native startup, the problem becomes even more important. AI can increase the volume of code, content, research, analysis, and administrative work very quickly. More output, however, does not automatically mean more customer value, faster learning, or better business performance.
The purpose of startup productivity metrics is therefore not to prove that everyone is working hard. It is to help founders answer a more useful question: is the team converting limited time, talent, and capital into meaningful outcomes with less friction?
Productivity in a Startup Means Outcomes, Not Visible Activity
Traditional productivity is easy to understand when the output is standardized. If a factory produces more units with the same resources, productivity has improved. Startup work is different. A founder can spend an entire day making one pricing decision that matters more than fifty completed tasks. An engineer can remove code and create more value than someone who writes thousands of lines. A marketer can stop three low quality campaigns and improve performance without publishing anything new.
That is why a lean team should separate activity from productivity. Activity shows that work happened. Productivity shows that the work improved an important outcome or made the path to that outcome more efficient.
A useful metric should help the team make a decision. If a number moves and nobody knows what action should follow, it is probably reporting noise rather than management information.
A Four Layer Model for Startup Productivity
The cleanest way to measure a startup is to avoid searching for one perfect productivity number. Instead, use a small set of signals across four layers: outcomes, output, flow, and quality. Each layer answers a different question, and together they prevent the team from optimizing one dimension at the expense of another.
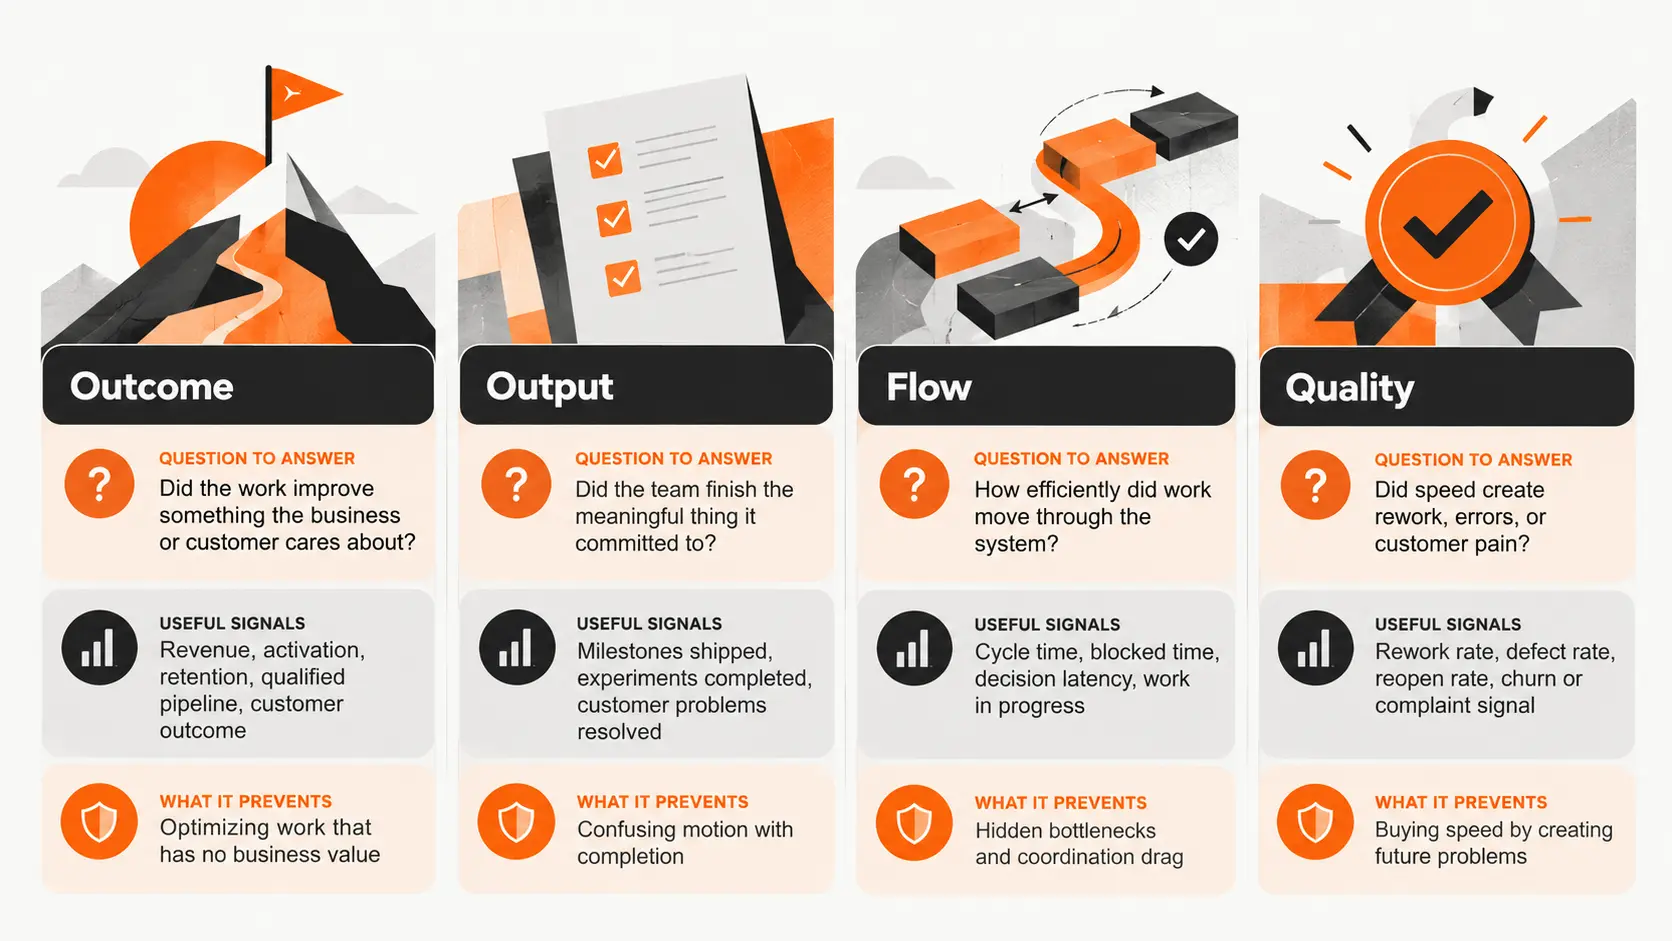
The value of this model is balance. A team that ships faster but creates more rework has not necessarily become more productive. A team that increases output while customer activation stays flat may simply be producing more of the wrong work. A team that improves revenue while cycle time keeps rising may be accumulating operational friction that will become expensive later.
The Startup Productivity Metrics That Usually Matter Most
Every startup has different goals, but a small set of metrics works well as a starting point because they expose whether work is creating value and where the system is slowing down.
Outcome completion rate.
Track whether the team completed the few outcomes it committed to for the week, sprint, or month. The emphasis is on outcomes, not the number of tasks underneath them. If the team planned three meaningful outcomes and completed two, that tells you more than saying it closed 47 tickets.
Cycle time.
Measure how long important work takes from active start to usable completion. Rising cycle time often reveals unclear ownership, too many approvals, overloaded specialists, or decisions waiting on a founder. Use it to find friction, not to compare individual employees.
Blocked time and decision latency.
Small teams lose disproportionate amounts of time when one decision stops several people. Track how long priority work remains blocked and how long important decisions wait for an owner. This is especially useful in founder led companies where many workflows still depend on one person.
Rework rate.
Speed is not useful when the same work keeps returning. Rework can mean reopened support tickets, repeated editing rounds, failed releases, corrected analyses, or sales proposals that repeatedly need major changes. The exact definition depends on the function, but the purpose is the same: measure how much capacity is being spent fixing work that was already considered done.
Customer or business impact.
At least one productivity metric should connect execution to the company's current business goal. For one startup that may be activation. For another it may be qualified pipeline, retention, successful onboarding, or revenue. Without this layer, teams can become very efficient at work that does not matter.
Metrics That Look Productive but Often Mislead Founders
The most dangerous startup metrics are not always useless. Many are useful as diagnostic signals, but become harmful when they are treated as proof of productivity.
Hours worked can show workload, but not the value created during those hours.
Tasks completed can reveal throughput, but easy tasks can inflate the number while hard, high impact work looks slow.
Messages sent and online status measure presence, not contribution.
Lines of code, commits, or pull requests measure engineering activity, not whether the product became more useful or reliable.
Content volume measures publishing activity, not whether marketing created qualified demand or customer understanding.
Meetings attended measure coordination cost more often than productivity.
These numbers are not forbidden. The mistake is turning them into targets or using them to rank individuals. Once people know a visible activity is being rewarded, the behavior often shifts toward the metric rather than the outcome the metric was supposed to represent.
How to Measure Productivity After Adding AI and Automation
AI makes weak productivity measurement easier to expose. A team can generate more drafts, more code, more research, and more customer responses while also creating more review work, more inconsistency, or more low quality output.
The right way to measure AI productivity is to compare the workflow before and after AI, not to count how much the AI produced.
For any AI assisted workflow, track four things:
Cycle time: did the workflow become meaningfully faster?
Human effort: did the team spend less time on repetitive execution or simply move that time into review and correction?
Quality: did rework, errors, customer complaints, or failed outputs increase?
Business outcome: did the faster workflow improve a result the company actually cares about?
For example, an AI assisted content process that doubles publishing volume but also doubles editing time and produces no additional qualified traffic is not clearly more productive. An AI sales research workflow that cuts preparation time by 60 percent while maintaining meeting quality has a much stronger case.
The best AI productivity metric is usually not an AI metric at all. It is a better business or workflow metric measured before and after the system changes.
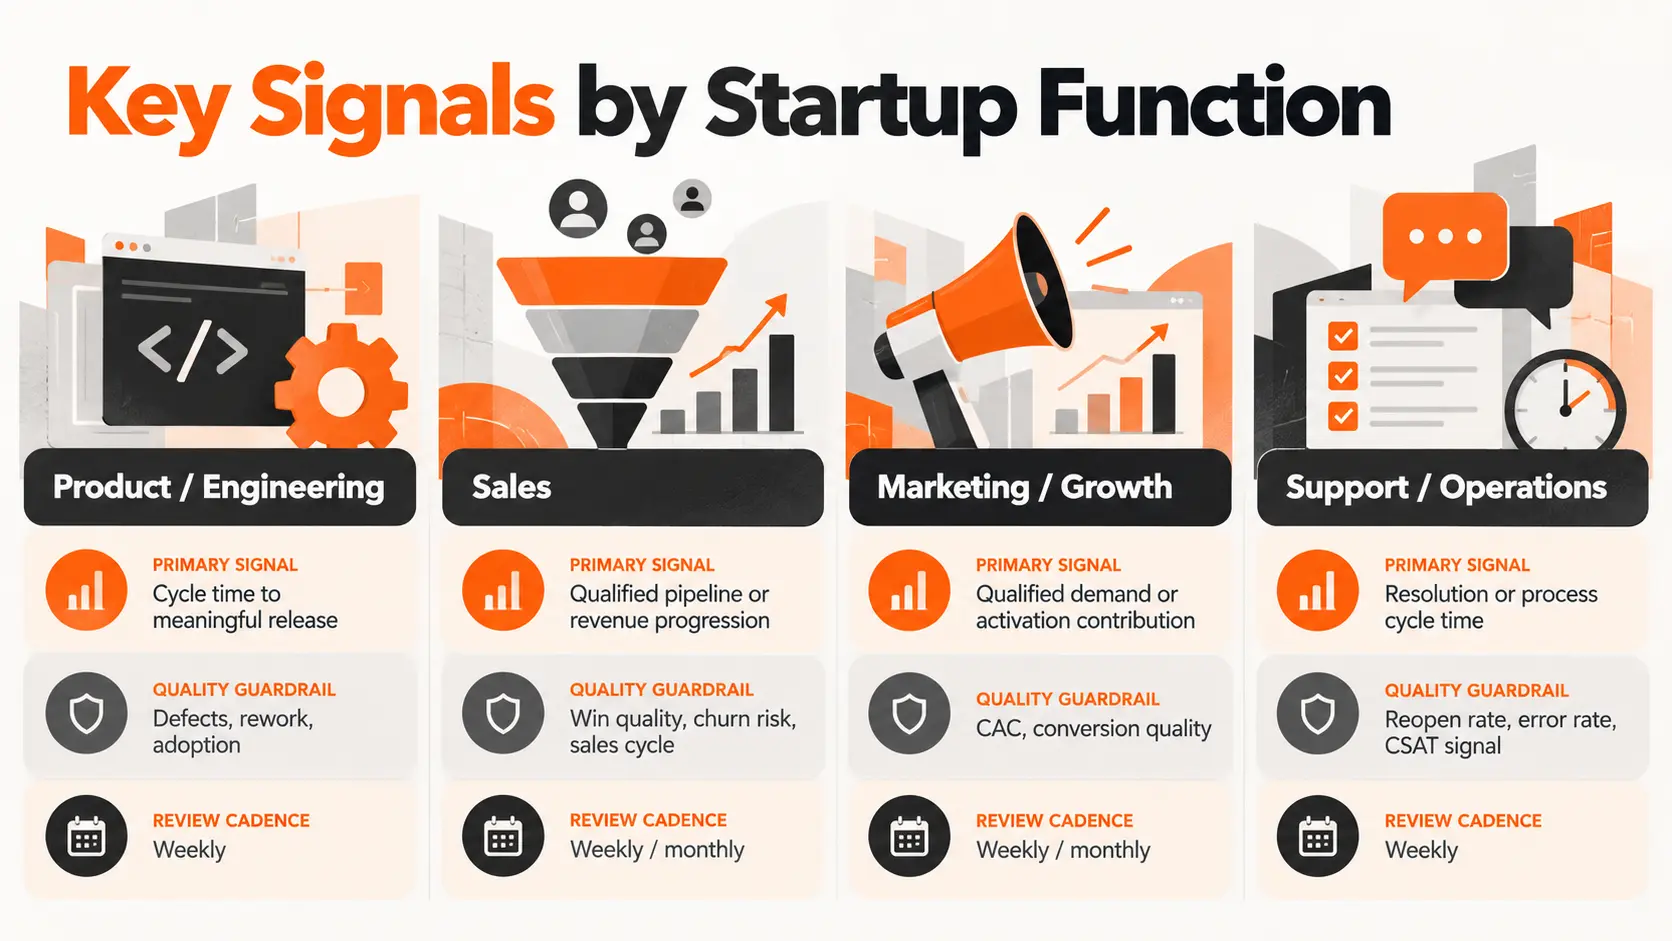
Different Startup Functions Need Different Productivity Signals
A company wide dashboard needs a common logic, but not every team should be measured by the same number. The metric should reflect the value that function is expected to create.
Product and Engineering
Useful signals include cycle time for meaningful changes, deployment or release reliability, adoption of shipped improvements, and rework or defect rates. Avoid using tickets closed or code volume as the main definition of productivity. A product team is productive when it learns and delivers customer value reliably, not when its backlog moves quickly.
Sales
Focus on movement through the revenue process: qualified opportunities created, conversion between meaningful stages, sales cycle time, and revenue or pipeline generated relative to the team's capacity. Activity metrics such as calls or emails can help diagnose a problem, but they should not replace the outcome.
Marketing and Growth
Measure the quality and efficiency of demand creation. Depending on the business, useful signals may include qualified leads, activation from campaigns, customer acquisition efficiency, conversion, or revenue contribution. Publishing more assets is only productive if those assets improve the next important business outcome.
Customer Support and Operations
Track resolution time, backlog age, repeat issue rate, handoff delay, and the percentage of work completed without escalation. Pair speed with a quality signal so faster handling does not create more reopened issues or dissatisfied customers.
A simple cross functional view can look like this:
Revenue per Employee Is Useful, but It Is Not a Team Score
Revenue per employee is becoming more visible as startups try to grow with smaller teams. The formula is simple: annual revenue divided by full time headcount. It can be useful because it shows, at a high level, whether revenue is scaling faster than the organization.
But founders should treat it as a company efficiency ratio, not a performance score for employees. It is a lagging metric and can be distorted by stage, business model, margins, outsourcing, contractor use, and the timing of hiring. A pre revenue startup can have an excellent team and a meaningless revenue per employee number. A services heavy company may naturally look different from a software company.
The most useful way to use revenue per employee is to track its trend over time and ask what changed. Did revenue grow without proportional headcount? Did automation increase capacity? Did a hiring wave temporarily lower the ratio before new employees ramped? The number creates a question. It does not provide the full diagnosis.
Build a Startup Productivity Dashboard That Can Fit on One Screen
Lean teams do not need a productivity command center. They need a small dashboard that makes friction and progress visible without creating reporting work.
A practical dashboard usually contains five to seven metrics:
1. One business outcome metric tied to the company's current priority.
2. One outcome completion metric showing whether planned priorities actually shipped.
3. One flow metric such as cycle time.
4. One friction metric such as blocked time or decision latency.
5. One quality guardrail such as rework or error rate.
6. One function specific metric for the area currently under pressure.
7. Optionally, one company level efficiency metric such as revenue per employee when the stage makes it meaningful.
Every metric should also have four definitions: an owner, a review cadence, a decision it can influence, and a guardrail that prevents obvious gaming.
Weekly reviews are usually best for flow and bottleneck metrics. Monthly reviews are better for business outcomes and efficiency trends. Quarterly reviews should ask whether the metrics themselves still match the company's stage and priorities.
Read Productivity Metrics as a System, Not One Number at a Time
The real value appears when metrics are read together. A single number tells you what changed. A combination of signals helps explain what may be happening.
Cycle time rises while blocked time rises: the problem may be ownership, dependencies, or slow decisions rather than effort.
Output rises while customer impact stays flat: the team may be shipping more of the wrong work.
Cycle time falls while rework rises: speed may be coming from weaker quality control.
AI assisted output rises while review time also rises: automation may have shifted work instead of removing it.
Revenue grows while headcount stays stable and quality holds: the operating model may be creating genuine leverage.
This is why founders should resist the urge to ask, “What is our productivity score?” A more useful question is, “Where is the system creating value, and where is it creating friction?”
Use Metrics to Improve the System, Not to Create Surveillance
Productivity measurement fails quickly when the team believes every number will be used to rank individuals. People start protecting the metric, avoiding difficult work, or choosing visible tasks over important ones.
Startup productivity metrics work best when they are primarily team and workflow measures. Their purpose should be to identify constraints, improve decisions, and make trade offs visible.
Founders should explain what each metric is for, how it will be used, and what it will not be used for. If cycle time increases, the first question should be what changed in the workflow, not who is slow. If output falls, look at priority changes, dependencies, rework, and customer complexity before turning the number into a performance judgment.
A healthy measurement system creates better conversations. A bad one creates better looking dashboards.
A Simple 30 Day Way to Start Measuring Productivity
Founders do not need to design the perfect framework before starting. A simple baseline is enough.
1. Choose the company's most important outcome for the next month.
2. Select one flow metric and one quality guardrail connected to the work that drives that outcome.
3. Define exactly when each metric starts and stops so the number remains consistent.
4. Measure the current baseline for two weeks without setting aggressive targets.
5. Review the metrics with the team and identify one constraint worth changing.
6. Make one process, automation, ownership, or staffing change.
7. Measure again and look for improvement across outcome, flow, and quality rather than one metric alone.
The goal is not to create a permanent scorecard in 30 days. It is to build a measurement habit where data leads to a specific operating decision and the team can see whether that decision worked.
Measure Progress, Not Activity
Startup productivity is not the amount of visible work a team produces. It is the company's ability to turn scarce attention, talent, and capital into meaningful outcomes without creating unnecessary friction or quality problems.
For lean teams, the strongest measurement systems are intentionally small. They connect business outcomes to execution, expose bottlenecks, protect quality, and make it easier to see whether AI, automation, hiring, or process changes are actually creating leverage.
If a metric does not help the team make a better decision, it does not need to be on the dashboard.
FAQ
What are startup productivity metrics?
Startup productivity metrics measure how effectively a team turns time, talent, and resources into meaningful business and customer outcomes.
What is the best productivity metric for a startup?
There is no single best metric. Most startups need a small combination of outcome, flow, and quality metrics.
Should startups measure employee hours?
Hours can help understand workload, but they should not be treated as the main measure of productivity for knowledge work.
How can a startup measure AI productivity?
Compare the workflow before and after AI using cycle time, human effort, quality, and business outcomes rather than counting AI generated output.
Is revenue per employee a good startup productivity metric?
It is useful as a high level company efficiency ratio, especially over time, but it is not a complete measure of team productivity.
How many productivity metrics should a startup track?
For a lean team, five to seven well defined metrics are usually more useful than a large dashboard of activity data.
How often should founders review productivity metrics?
Flow and bottleneck metrics can be reviewed weekly, while business outcomes and company efficiency metrics are often more useful monthly or quarterly.

Mohsen Avid
Founder & Editor, PinerookMohsen Avid is the founder of Pinerook, covering entrepreneurship, startup strategy, digital business, and the decisions behind building new ventures.
 Seen first.