Founders do not need to become economists. They do need to recognize when the external environment is changing the assumptions behind demand, hiring, pricing, financing, or runway.
That is the practical value of macroeconomics for startups: not predicting the economy, but identifying the small number of signals that can materially change how a company should operate.
The mistake is treating every major data release as equally important. GDP, inflation, unemployment, interest rates, retail sales, wage growth, consumer confidence, credit conditions, and market valuations all describe different parts of the economy. A founder who tracks all of them without a clear business connection can end up with more information and less clarity.
A better approach is to build a founder dashboard around exposure. Track the indicators that can change your customers' behavior, your cost base, your ability to hire, or your access to capital. Then confirm those external signals with what is actually happening inside the company.
The Best Economic Indicator Is the One That Connects to a Decision
Economic indicators are useful only when they can change an operating decision. A founder should be able to explain the transmission path from the data release to the business.
For example, a rise in consumer inflation may matter because it reduces household purchasing power, raises wage expectations, or increases supplier costs. A change in bank lending standards may matter because your customers rely on credit or because your next expansion requires debt. A weaker labor market may matter because hiring becomes easier even while customer demand becomes less certain.
That leads to four questions for every indicator you consider adding to a dashboard:
Relevance: Which part of our business can this indicator affect?
Direction: Is the signal improving, worsening, or simply volatile?
Timing: Does it lead our business, move with it, or confirm something that already happened?
Internal confirmation: Which company metric should move if this macro signal is actually reaching us?
If you cannot answer those questions, the indicator is probably context rather than a management signal.
The Founder Dashboard in One View
Most startups can begin with a compact set of indicators and expand only when the business model creates a clear reason to do so.
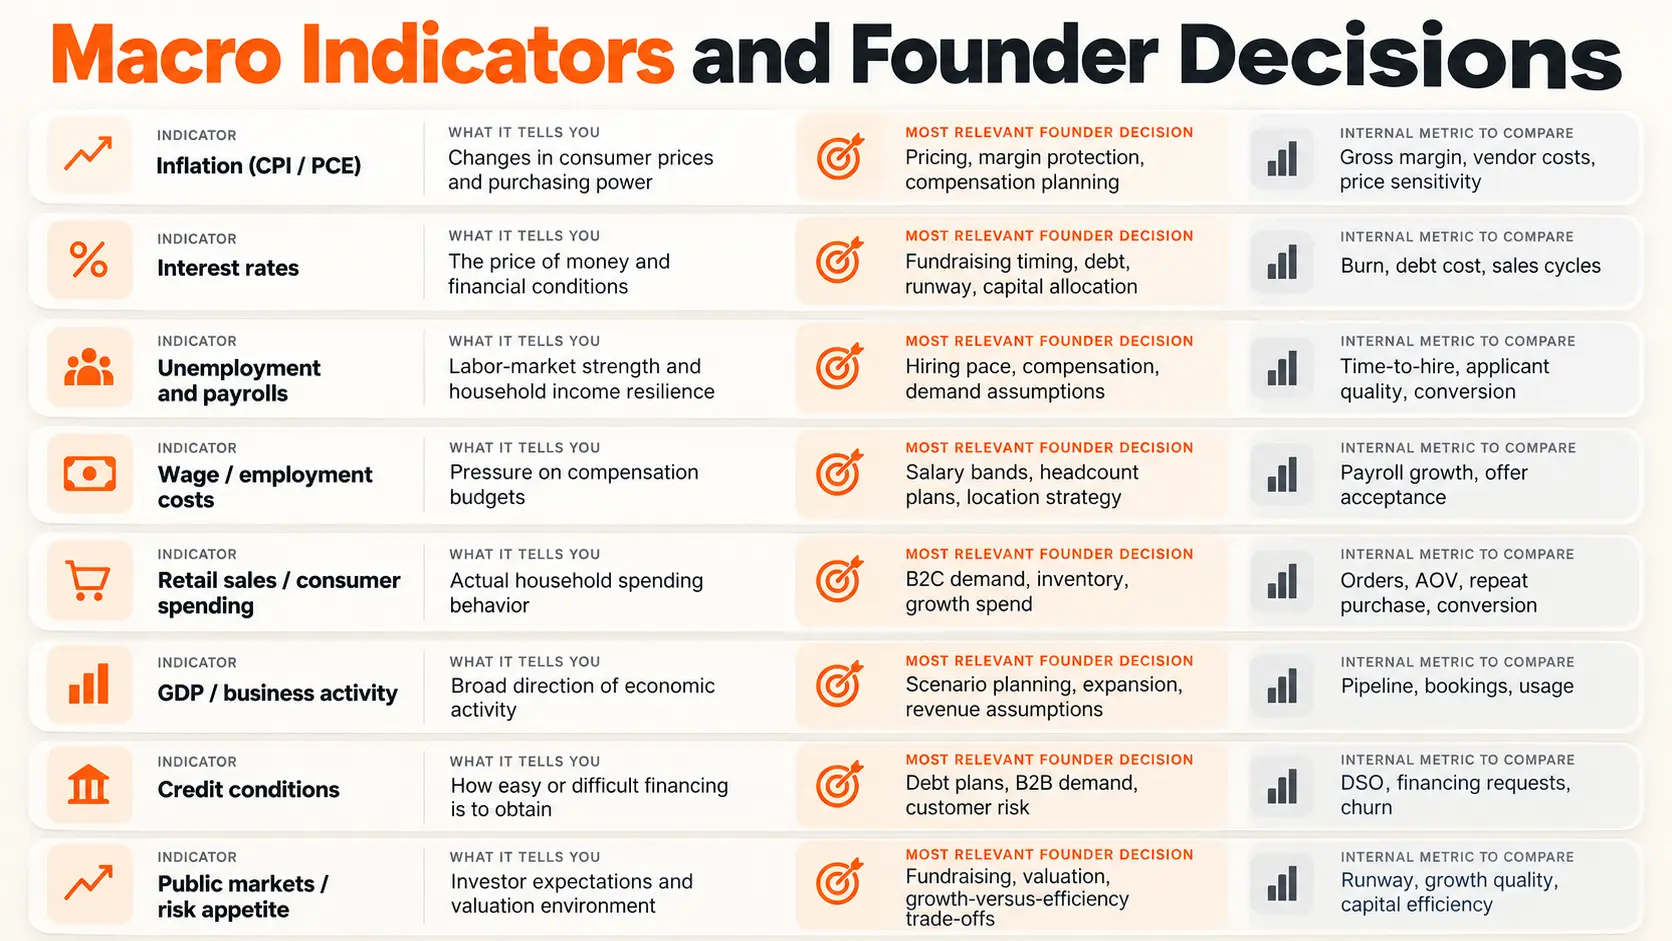
Inflation: Track the Part That Actually Hits Your Business
Inflation is one of the most widely reported economic indicators and one of the easiest to misuse. The headline Consumer Price Index is useful context, but a startup rarely experiences the economy through the same basket as the average household.
A software company may care more about wages and cloud infrastructure than food prices. A hardware company may be exposed to freight, energy, imported components, and supplier pricing. A consumer startup may care most about the pressure inflation puts on discretionary spending.
The founder question is therefore not simply, “Is inflation high?” It is, “Which cost or demand channel is moving faster than our ability to adapt?”
As of August 2026, U.S. CPI was 3.4% higher than a year earlier, while core CPI was up 2.4%. Energy prices were much more volatile, rising 16.3% year over year. illustrates why founders should look below the headline when their cost base is concentrated in a specific category.
Use inflation data to challenge assumptions about pricing, compensation, vendor costs, and customer purchasing power. Do not use it as a substitute for your own gross margin and customer behavior data.
Interest Rates: Watch the Cost of Capital and the Customer's Cost of Money
Interest rates affect more than startup debt. They influence the return investors demand, the financing cost of customers, public market valuations, and the attractiveness of holding cash versus deploying it aggressively.
The Federal Reserve's target range for the federal funds rate was 3.75% to 4.00% after its September 2026 decision. Federal Reserve policy rate history gives founders the current benchmark, but the important business question is how financing conditions transmit into their own market.
If you are venture backed, compare changes in rates with fundraising timelines, valuation expectations, and investor selectivity. If customers finance purchases, compare rate conditions with sales cycle length and conversion. If you use debt, monitor the actual borrowing rate and refinancing schedule rather than the policy rate alone.
Employment and Unemployment: Use Them as Demand and Hiring Signals
The labor market matters to startups from both sides. Strong employment can support household demand and customer confidence, but it can also make talent more expensive and harder to recruit. A softer labor market can improve hiring conditions while increasing the risk that demand weakens.
In September 2026, U.S. unemployment was 4.2% and nonfarm payrolls increased by 29,000, with little change across major industries.
A national unemployment rate may say little about the market for senior AI engineers, enterprise account executives, or nurses in a specific city. Pair labor market data with time to hire, qualified applicants per role, offer acceptance, compensation expectations, and voluntary turnover.
Wage Growth: A Better Hiring Cost Signal Than Unemployment Alone
Founders making headcount plans should track compensation pressure separately from the unemployment rate.
The Employment Cost Index showed private industry compensation costs up 3.3% over the 12 months ending June 2026, with private industry wages and salaries up 3.1%. compensation trend from a temporary movement in one hiring channel.
For a startup, the practical comparison is wage growth versus revenue growth and productivity. If payroll is growing materially faster than the value created by the team, the issue is not simply macroeconomics; the operating model may need attention.
Sentiment indicators can provide useful early context, but actual spending data is often more concrete for consumer facing startups.
U.S. retail and food service sales increased 1.2% in August 2026 from the previous month and 6.0% from a year earlier, according to the Census Bureau.
B2C founders should compare broad spending data with conversion, order frequency, average order value, discount use, and payment behavior. If the national data looks strong but your segment is weakening, your segment matters more.
GDP and Business Activity: Use Them for Context, Not Weekly Decisions
GDP is useful because it summarizes broad economic activity, but it is a slow and heavily aggregated measure. It is better suited to scenario planning than to day to day operating decisions.
The latest third estimate showed U.S. real GDP growing at a 2.2% annual rate in the second quarter of 2026, after 2.5% in the first quarter. Bureau of Economic Analysis GDP release shows that even a positive headline can contain different underlying movements in consumption, investment, exports, and government spending.
Founders should ask which part of economic activity drives their customer base. Enterprise software may be more sensitive to business investment and budgets. A consumer marketplace may care more about household spending. Industrial startups may care about manufacturing, construction, or capital expenditures.
The broad economy provides context. Your customer sector provides the operating signal.
Credit Conditions: One of the Most Underrated Founder Signals
The policy interest rate tells you the general price of money. Credit conditions tell you whether businesses and households can actually obtain it.
In the Federal Reserve's July 2026 Senior Loan Officer Opinion Survey, banks reported basically unchanged standards for commercial and industrial loans to firms of all sizes, while demand from small firms was also broadly unchanged. Federal Reserve SLOOS is especially useful for startups whose customers depend on bank financing or whose own plans include credit facilities.
A founder selling to construction firms, auto buyers, small businesses, or other credit sensitive customers should watch lending standards and customer financing behavior alongside rates. Sometimes the rate changes little while access to credit changes significantly.
Public Markets: Treat Them as a Risk Appetite Signal
Public markets are not a pure economic indicator, but for venture backed startups they provide a useful read on how investors are pricing growth, profitability, and risk.
A founder does not need to watch daily index movements. More useful questions are whether comparable public companies are seeing multiple compression or expansion, whether IPO markets are open, and whether investors are rewarding growth at any cost or demanding stronger margins and cash generation.
This matters most for companies approaching larger private rounds or an eventual public market comparison. For a bootstrapped pre seed company, it may be background noise.
Know Whether an Indicator Leads, Confirms, or Lags
Founders often make the mistake of reacting to indicators as if they all describe the same point in time.
Some indicators can move before the broader economy, some describe current conditions, and others confirm what has already happened. The categories are not perfect, but they help prevent overreaction.
Leading signals can include credit conditions, new orders, hiring intentions, financial markets, and some confidence measures.
Coincident signals include payrolls, spending, production, and current business activity.
Lagging signals often include outcomes that adjust after conditions have already changed, such as some employment, default, and profit measures.
The stronger signal usually comes from several indicators pointing in the same direction and from your internal metrics beginning to confirm the same story.
Read the Level, the Trend, and the Surprise Separately
A single number can be misleading unless you know what changed.
For every economic release, separate three questions:
Level: Is the indicator high, low, tight, weak, or strong relative to history?
Trend: Has it been improving or deteriorating for several periods?
Surprise: Was the result materially different from what markets and businesses expected?
A high unemployment rate that is falling quickly can tell a different story from a lower unemployment rate that is rising every month. Inflation at 3% after falling from 8% is different from 3% after rising from 1%. Direction changes the meaning.
Never Let a Macro Indicator Override Your Own Customer Data
The economy is an average. Startups live in segments.
A company selling cybersecurity software to regulated enterprises can grow during a broad slowdown. A travel marketplace can weaken while GDP is still positive. A hiring platform can feel labor market changes months before they are obvious in the headline unemployment rate.
For every external signal, define one or two internal metrics that should move if the macro story is relevant.
Demand signals can be tracked through pipeline quality, conversion, sales cycle length, and repeat purchases.
Inflation signals appear in gross margin, vendor quotes, payroll growth, and price sensitivity.
Labor signals show up in applicant quality, time to hire, offer acceptance, and attrition.
Credit signals can be seen in payment delays, financing requests, customer defaults, and postponed deals.
Capital market signals appear in fundraising duration, investor response rates, and valuation expectations.
If the external indicator changes but the company's operating data does not, watch the situation rather than forcing a strategic response.
Different Startups Need Different Economic Dashboards
There is no universal list of ten indicators that deserves equal attention. The dashboard should reflect the company's economic exposure.
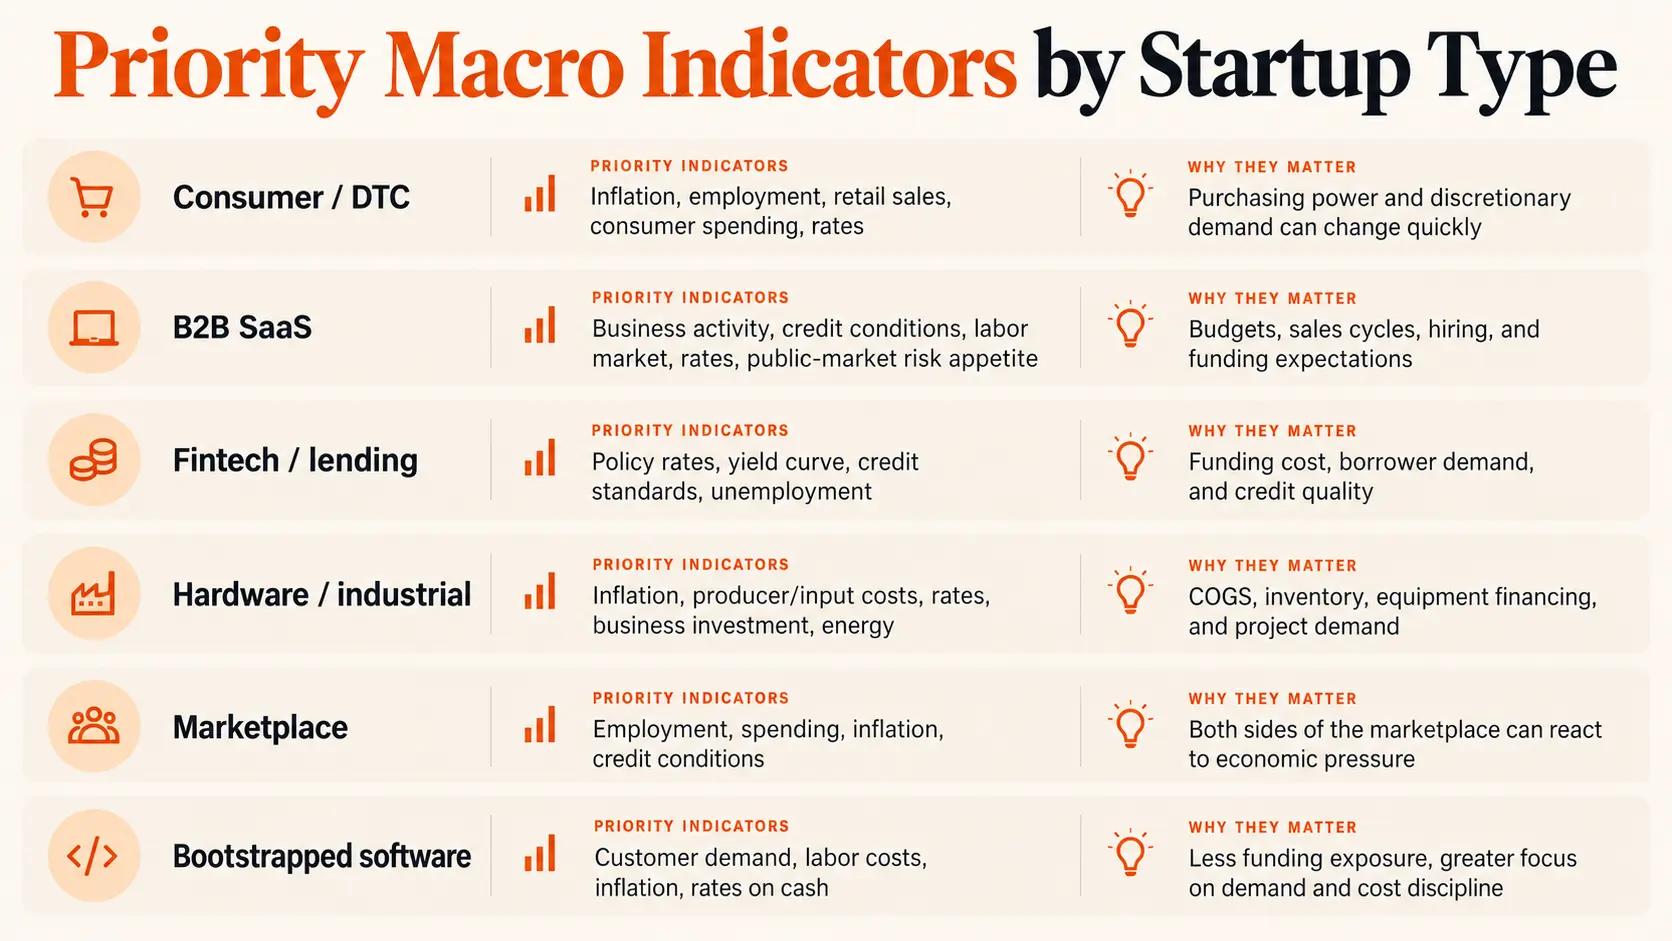
A 2026 Example: Mixed Signals Are Normal
A founder looking at the U.S. economy in early October 2026 would see a mixed picture rather than one simple message.
Inflation remained above the Federal Reserve's long run 2% objective, with CPI up 3.4% year over year in August. The Fed's target rate stood at 3.75% to 4.00%. Unemployment was 4.2% in September, payroll growth was modest, real GDP was still expanding, retail sales had risen, and bank lending standards for small firm commercial loans were broadly unchanged in the latest survey.
None of those facts independently tells a startup to hire, cut, raise prices, or preserve cash. Together, they describe an environment in which growth continues but cost, financing, and demand conditions can differ sharply by customer and business model.
That is exactly why the dashboard should lead to questions rather than automatic decisions.
Build a Monthly Founder Dashboard, Not a Daily Macro Feed
Most early stage teams do not need to watch economic data every morning. A monthly review is usually enough, with a deeper quarterly discussion around planning assumptions.
A useful dashboard can fit on one page:
Choose four to six external indicators tied to the company's largest economic exposures.
Record the latest level, three to six month trend, and whether the change is material.
Place the relevant internal metric next to each external indicator.
Write one sentence explaining what would cause the team to change an assumption.
Do not add a new indicator unless it improves a real decision.
For example, a consumer startup might pair CPI with gross margin, unemployment with conversion, retail sales with order growth, and interest rates with financing sensitive customer behavior.
A B2B startup might pair credit conditions with sales cycle length, employment costs with hiring plans, GDP or business investment with pipeline quality, and public market conditions with fundraising assumptions.
Convert Indicators Into Decision Triggers
The point of tracking an indicator is not to create a better presentation. It is to reduce the time between a meaningful change and a better decision.
Instead of writing “watch the economy,” define thresholds around company behavior.
If sales cycles extend materially for two consecutive months while customer credit conditions tighten, review the revenue plan.
If compensation benchmarks rise faster than productivity and revenue, revisit hiring pace or role design.
If input costs rise but pricing remains unchanged, run a margin and willingness to pay review.
If fundraising conditions deteriorate and runway falls below the next proof point, change the capital plan before urgency removes options.
These are not universal thresholds. Each startup should choose triggers based on its own economics and tolerance for risk.
Common Mistakes When Founders Track the Economy
Tracking too many indicators. A long dashboard makes weak signals look important. Start with the variables that have a clear path into the business.
Reacting to one monthly release. Economic data is noisy and often revised. Look for trends and confirmation before changing strategy.
Using national averages for a narrow market. Your customer segment, city, industry, or talent pool may behave very differently from the headline economy.
Confusing nominal growth with real growth. Sales can rise because prices rose. When inflation is material, ask whether underlying volume and purchasing power actually improved.
Treating confidence as behavior. Sentiment can move before spending, but customers ultimately reveal reality through purchases, renewals, budgets, and payment behavior.
Blaming macro conditions for company specific problems. Weak retention, poor positioning, bad execution, and a product customers do not value cannot be fixed by a better economic forecast.
Track the Economy Through the Business
Economic indicators are most useful when they help founders understand why customer behavior, costs, hiring, or capital conditions may be changing before the effect becomes obvious in financial results.
The strongest founder dashboard is not the one with the most data. It is the one that connects a small number of external signals to internal metrics and clear decisions.
Track inflation where it affects your margins. Track employment where it affects demand or talent. Track rates and credit where financing matters. Use GDP and broad activity as context. Then let customers, unit economics, and company specific evidence determine what you actually do.
FAQ
What economic indicators should startup founders track?
Most founders should start with inflation, interest rates, labor market conditions, wage growth, customer spending indicators, broad business activity, and credit conditions. The final list should depend on the startup's business model and customer exposure.
What is the most important economic indicator for a startup?
There is no universal single indicator. The most useful one is the indicator with the clearest connection to a major business decision, such as customer demand, hiring cost, pricing, runway, or access to capital.
How often should founders review economic indicators?
For most early stage startups, a monthly review is sufficient, with a deeper quarterly review when updating forecasts, hiring plans, pricing, or fundraising assumptions.
Should startups track GDP?
Yes, but mainly as broad context. GDP is too aggregated and slow moving for many day to day decisions, so founders should combine it with sector data and internal customer metrics.
Are consumer confidence indicators useful for startups?
They can be useful for consumer facing businesses as an early signal of caution or optimism, but founders should confirm the signal with actual spending, conversion, order frequency, and retention.
How should a startup use macroeconomic data without overreacting?
Focus on trends rather than one release, compare external signals with internal metrics, and define decision triggers before conditions become stressful.

Masoumeh Jahangard
Markets & Economy Writer at PinerookMasoumeh Jahangard covers markets, economic trends, and business conditions for Pinerook, focusing on how they affect startups and growing companies.
 Seen first.