
A startup can attract customers and report growing sales while remaining uncertain about its financial future. Founders may know the current bank balance but struggle to determine whether they can afford another employee, survive delayed payments, or finance expansion. Separate revenue forecasts and expense estimates are not enough when the decisions that affect them are connected.
A financial model for startups turns operating assumptions into linked projections of revenue, costs, profitability, and cash. Within the broader framework of Startup Finance, it shows how changing customer growth, hiring plans, payment terms, or prices affects the business as a whole. A useful model does not promise perfect predictions. It makes assumptions visible and their financial consequences measurable.
This guide explains how to build a practical model in Excel or Google Sheets, connect the three financial statements, test scenarios, and check for errors. A six month example demonstrates why improving operating results may not prevent cash from declining.
What Is a Financial Model for Startups?
A startup financial model is a structured set of calculations that describes how a business could perform under specific assumptions. It usually connects customer activity, pricing, delivery costs, operating expenses, payment timing, and financing decisions to projected financial statements.
A subscription startup, for instance, might plan to add ten paying accounts each month. That assumption changes subscription revenue and service costs. Hiring more employees changes expenses and cash payments. If customers pay after receiving a service, reported revenue and collected cash will differ. An integrated model captures these relationships instead of calculating each result independently.
A model is different from a financial plan, which sets objectives and spending priorities, and a financial forecast, which presents expected outcomes. The model is the calculation framework used to produce and revise those outcomes.
What Should a Startup Financial Model Include?
An early stage model should be detailed enough to explain how the business works without making every uncertain estimate unnecessarily complicated. These worksheets can form a practical starting structure.
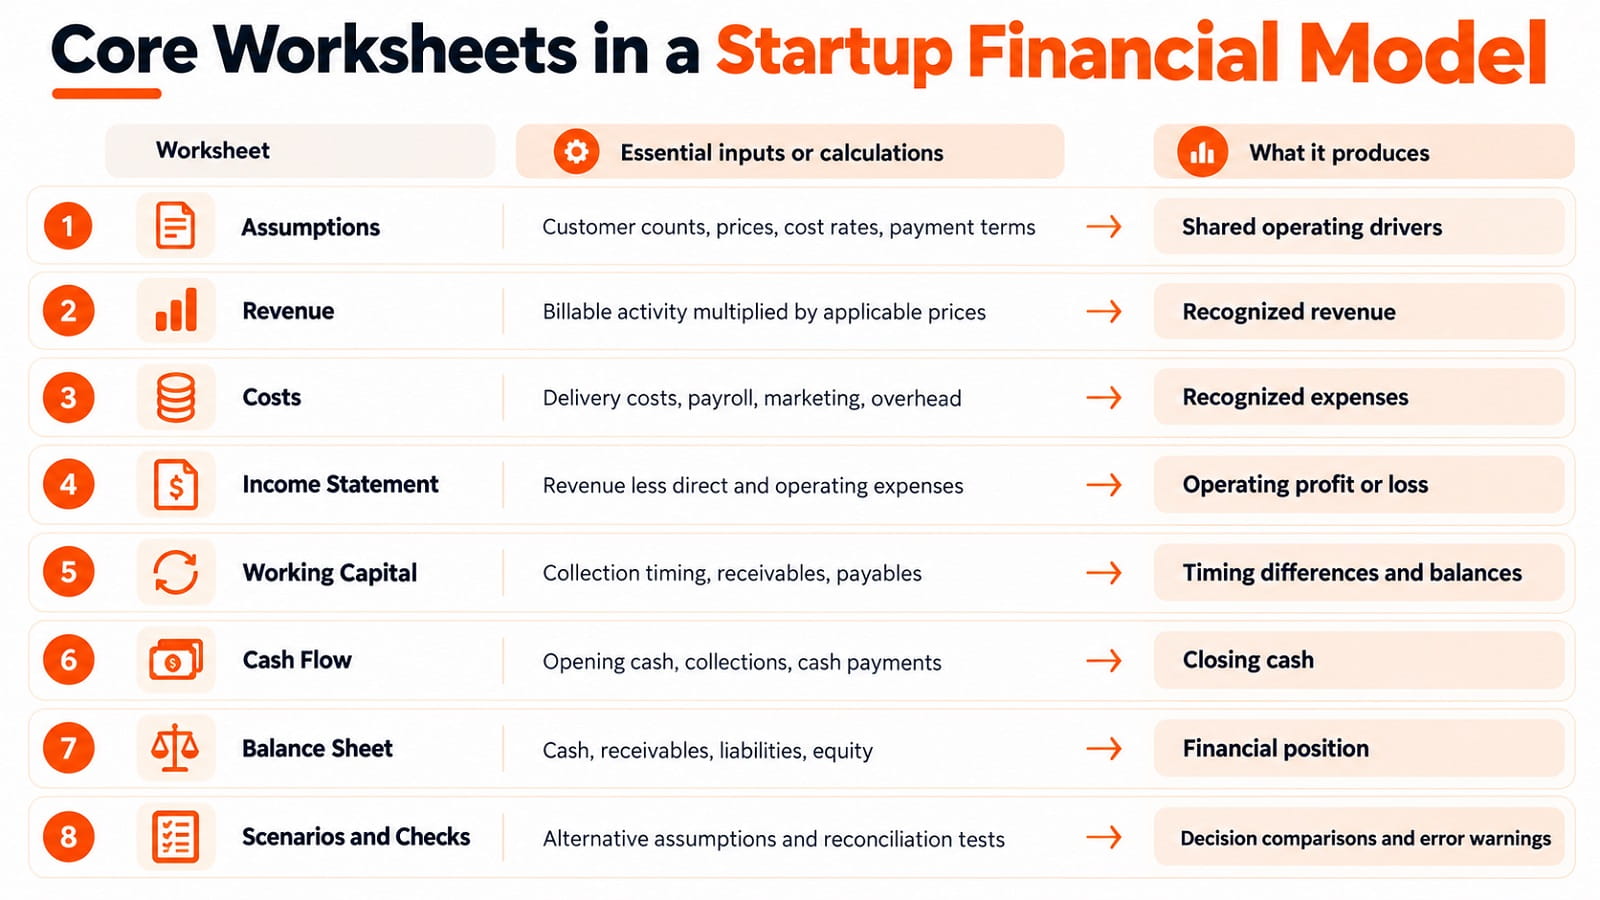
Start with the sections your business genuinely needs. A company without debt or equipment purchases can use a simpler initial structure. Once those activities become relevant, add schedules rather than hiding them in unexplained adjustments.
How to Build a Startup Financial Model in Excel or Google Sheets
The following process works in either spreadsheet application. Use one column for each forecast month, and keep inputs separate from formulas so that changing an assumption updates every affected result.
Step 1: Create the Time Periods and Assumptions
Create an Assumptions worksheet with six monthly columns, B through G. Put forecast customer counts in row 2, subscription price in row 3, direct delivery cost rate in row 4, same month collection percentage in row 5, and operating expenses in row 6.
For the example below, customer counts are 100, 110, 120, 130, 140, and 150. Monthly price is $200, delivery costs are 25% of revenue, and 80% of revenue is collected in the month it is earned. Operating expenses are $30,000, $30,000, $31,000, $31,000, $32,000, and $32,000. Record opening cash of $250,000 and opening receivables of $4,000 in clearly labeled separate cells.
These are illustrative assumptions, not industry averages. Identify the source of every important input, especially estimated growth and payment behavior.
Step 2: Calculate Revenue From Business Activity
Create a Revenue worksheet with the same monthly columns. Link billable customers and price to Assumptions rather than typing the values again. Multiply customer count by monthly price to calculate recognized subscription revenue.
In month one, 100 accounts multiplied by $200 produces $20,000. In month two, 110 accounts produce $22,000. Extend the calculation across all six months by copying the formula horizontally with the appropriate column references.
For a real subscription business, add separate rows for opening customers, new customers, cancellations, and ending customers. In this illustration, customer counts increase by ten each month after month one and there are no cancellations. Record annual prepayments or partial service periods separately when relevant.
Step 3: Connect Delivery Costs and Operating Expenses
In a Costs worksheet, multiply recognized revenue by the delivery cost rate. Month one revenue of $20,000 multiplied by 25% produces $5,000 in direct costs. Link operating expenses directly to the Assumptions worksheet.
In the Income Statement worksheet, link revenue from Revenue and expenses from Costs. Subtract direct costs from revenue to calculate gross profit, then subtract operating expenses to calculate the operating result.
For month one, $20,000 in revenue less $5,000 in delivery costs and $30,000 in operating expenses gives an operating loss of $15,000. Keep depreciation, interest, and taxes in separate rows if the business has those items.
Step 4: Model When Customer Payments Arrive
In Working Capital, calculate cash receipts using payment timing rather than assuming recognized revenue equals cash. Here, 80% of current month revenue arrives immediately and 20% is collected the following month.
Month one receipts are $16,000 from current revenue plus the $4,000 opening receivable, totaling $20,000. Month two receipts are $17,600 from month two revenue plus $4,000 from month one, totaling $21,600.
Ending receivables equal the uncollected 20% of current month revenue. Month one ends with $4,000 in receivables and month six ends with $6,000. If suppliers allow delayed payments, build a corresponding payable schedule instead of assuming every expense is paid immediately.
Step 5: Connect Cash Flow and the Balance Sheet
In Cash Flow, start with $250,000 in opening cash, add collections from Working Capital, and subtract the actual cash payments. In this example, all direct costs and operating expenses are paid in the months they are recognized.
Month one closing cash is therefore $250,000 plus $20,000 of receipts less $35,000 of payments, or $235,000. Month two begins with that $235,000 balance. Never manually enter each month's closing cash when it can be calculated from the previous period.
In Balance Sheet, link cash to Cash Flow and receivables to Working Capital. Carry forward equity using the modeled operating results. If the startup has loans, investments, fixed assets, or deferred revenue, include the appropriate balances and related cash movements.
Step 6: Add Automatic Model Checks
Create a Checks area that calculates assets less the sum of liabilities and equity for every month. The result should equal zero. Also check that cash at the end of one month equals cash at the beginning of the next and that ending receivables equal opening receivables plus recognized revenue less cash collected.
Use spreadsheet conditional formatting to highlight nonzero check results. Protect formula cells where practical and label manual assumptions clearly. A balance sheet difference should trigger investigation, never an invented adjustment inserted simply to make the model balance.
A Six Month Financial Model Example
ClearPath Cloud is a fictional subscription software startup. It begins with $250,000 in cash and $4,000 in receivables, with no liabilities in this simplified example. Its starting equity is therefore $254,000.
ClearPath has 100 billable accounts in month one and adds ten accounts each subsequent month without cancellations. Each account produces $200 in recognized monthly revenue. Direct delivery costs equal 25% of revenue, and operating expenses rise as the company expands.
The company collects 80% of current month revenue during that month and the remaining 20% in the following month. All modeled expenses are paid when recognized. The example excludes taxes, depreciation, equipment purchases, borrowing, new investment, and advance customer payments to make the accounting connections easier to examine.
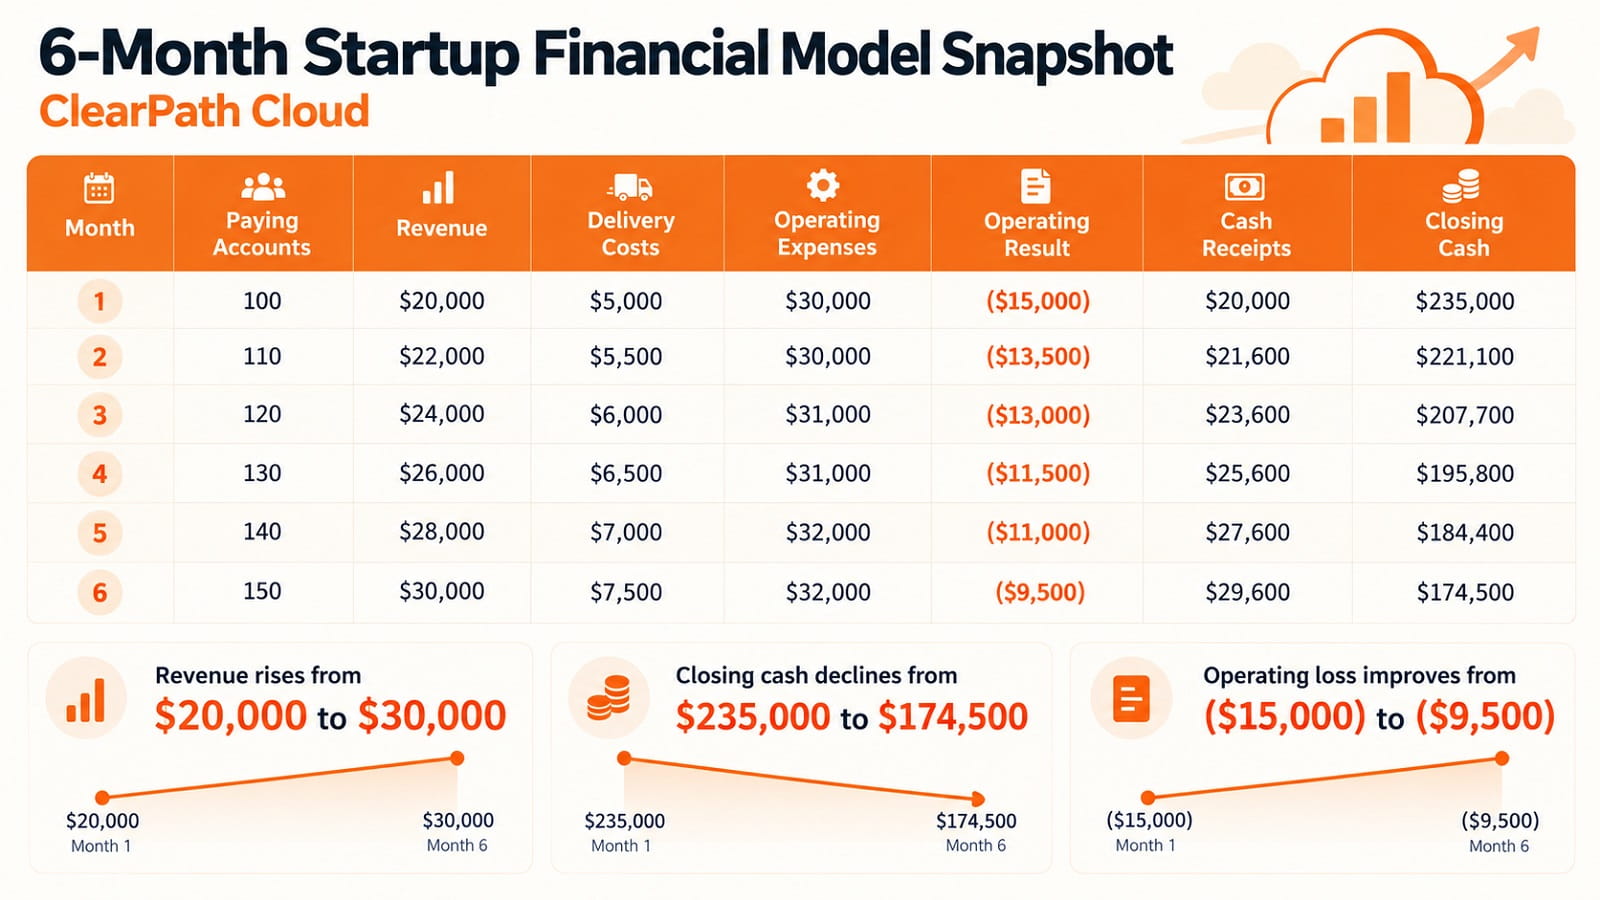
Across six months, revenue totals $150,000, delivery costs total $37,500, and operating expenses total $186,000. The cumulative operating loss is $73,500. Cash receipts total $148,000, while cash payments total $223,500, producing a $75,500 decline in cash.
The operating loss improves from $15,000 in month one to $9,500 in month six, but the company still consumes cash. That difference between improving results and continuing liquidity pressure is precisely what an integrated model should reveal.
How the Income Statement, Cash Flow, and Balance Sheet Reconcile
ClearPath reports a cumulative operating loss of $73,500 while cash falls by $75,500. The additional $2,000 decline comes from an increase in receivables. Customers owed $4,000 at the start and $6,000 at the end, so $2,000 of recognized revenue has not yet been collected.
The balance sheet also reconciles. Opening assets are $254,000, consisting of $250,000 cash and $4,000 receivables. With no liabilities, opening equity is $254,000. After the modeled cumulative loss, closing equity equals $180,500.
Closing assets equal $174,500 cash plus $6,000 receivables, also $180,500. This equality demonstrates that the simplified income, cash, and balance sheet calculations agree.
Real models may require accounts payable, prepaid expenses, equipment, depreciation, debt, deferred revenue, financing proceeds, and taxes. Each additional item should connect to the relevant statement rather than being added only as a final cash adjustment.
How to Run Financial Scenarios and Sensitivity Tests
Create copies of important assumptions as a base case, a stronger growth case, and a more difficult case. Change drivers rather than manually editing output figures. This preserves the links among revenue, profit, cash, and the balance sheet.
If ClearPath adds $5,000 in monthly payroll beginning in month four, cash payments increase by $15,000 across the remaining forecast. Closing cash falls from $174,500 to $159,500, assuming no change in customer activity.
If only 60% of month six revenue is collected immediately rather than 80%, cash receipts in that month fall by $6,000. Closing cash becomes $168,500 while receivables rise by $6,000. Recognized revenue and operating result do not change because this scenario affects collections, not delivery.
If ten additional customers receive a full month of service in month six, recognized revenue rises by $2,000, direct costs rise by $500, and immediate collections increase by $1,600. Under the same assumptions, closing cash becomes $175,600. The remaining $400 becomes additional receivables.
These results illustrate why founders should test customer growth, spending, and payment timing separately before evaluating their combined effects.
Adjusting a Model for Different Startup Types
Subscription Software
Add customer acquisition, cancellations, upgrades, service periods, and contract billing. Annual prepayments may create cash before revenue is recognized, requiring a deferred revenue schedule. Usage based delivery costs should follow actual activity rather than a fixed percentage when necessary.
Ecommerce
Forecast order volume, realized selling prices, refunds, product costs, inventory purchases, and fulfillment. Inventory may consume cash before a product is sold, so a model without an inventory schedule can materially misstate liquidity.
Marketplace
Separate gross transaction value from platform revenue. Model qualifying transactions, commissions, incentives, processing costs, and payment settlement timing according to the platform's contractual role. Do not assume the entire purchase price is revenue earned by an intermediary.
How to Maintain an Accurate Financial Model
Update the model when new actual results become available, commonly each month. Replace prior forecasts with verified accounting results, preserve the earlier forecast for comparison, and investigate significant differences.
A useful review asks whether the variance arose from customer activity, pricing, direct costs, hiring, or payment timing. It also checks whether the difference is temporary or likely to continue. Keep assumptions traceable to invoices, customer reports, payroll commitments, or clearly labeled estimates.
When liquidity is limited, the monthly financial model should be supported by a more detailed weekly cash forecast. Monthly projections may conceal a shortage that occurs before expected customer payments arrive.
Common Startup Financial Modeling Mistakes
Revenue projections can become misleading when growth rates are entered without explaining which customers, prices, or transactions create the increase. Similarly, a model may report improving profit while ignoring invoices that customers have not paid.
Other frequent problems include counting financing proceeds as operating revenue, forgetting taxes or capital purchases, double counting obligations, mixing cash payments with accounting expenses, and changing spreadsheet definitions between periods.
Overly complex models can be just as problematic. Hundreds of unsupported assumptions do not create reliable forecasts. Start with the drivers that materially affect decisions and add complexity only when the underlying business activity requires it.
Frequently Asked Questions
What Is a Financial Model for Startups?
It is a linked system of financial calculations that turns operating assumptions into forecasts of revenue, expenses, profitability, cash movements, and financial position.
How Do You Build a Startup Financial Model?
Define operating assumptions, calculate revenue and expenses, connect the income statement with collections and payments, and reconcile the resulting cash flow and balance sheet. Test alternative scenarios before using the outputs for major decisions.
What Are the Three Main Financial Statements?
The income statement explains recognized financial performance, the cash flow statement explains movements in cash, and the balance sheet reports assets, liabilities, and equity at a point in time.
Can a Startup Without Revenue Build a Model?
Yes. A company before its first sale can forecast hiring, development spending, cash requirements, and alternative customer adoption scenarios. Revenue assumptions should be labeled as estimates rather than historical results.
Is Excel or Google Sheets Better for Startup Modeling?
Both can support a reliable early stage model. Consistent definitions, linked formulas, reconciliation checks, and regular updates matter more than the choice of spreadsheet application.
How Far Ahead Should a Startup Forecast?
Monthly projections over 12 to 24 months often support operating decisions, with longer strategic scenarios when needed. The appropriate horizon depends on available evidence and the decisions the company must make.
Why Can Profit Improve While Cash Declines?
Revenue may be recognized before customers pay, and the business may continue making cash payments even while its operating loss shrinks. Working capital and investment timing explain many differences.
Final Thoughts
A financial model for startups gives founders a connected view of the consequences of their decisions. It links customer activity and operating costs to recognized performance, cash availability, and the company's financial position.
The ClearPath example shows why the connections matter: operating losses become smaller, yet cash continues to decline because expenses exceed collections and receivables increase. A working model makes those effects visible and testable.
The most useful model is not necessarily the most complex. It is one with defensible assumptions, linked calculations, reliable checks, and a regular review process that supports decisions before financial problems become urgent.

Mobina Khanki
Venture & Funding Writer at PinerookMobina Khanki covers venture capital, startup funding, fundraising, and startup finance for Pinerook, focusing on founders and investors.
 Seen first.