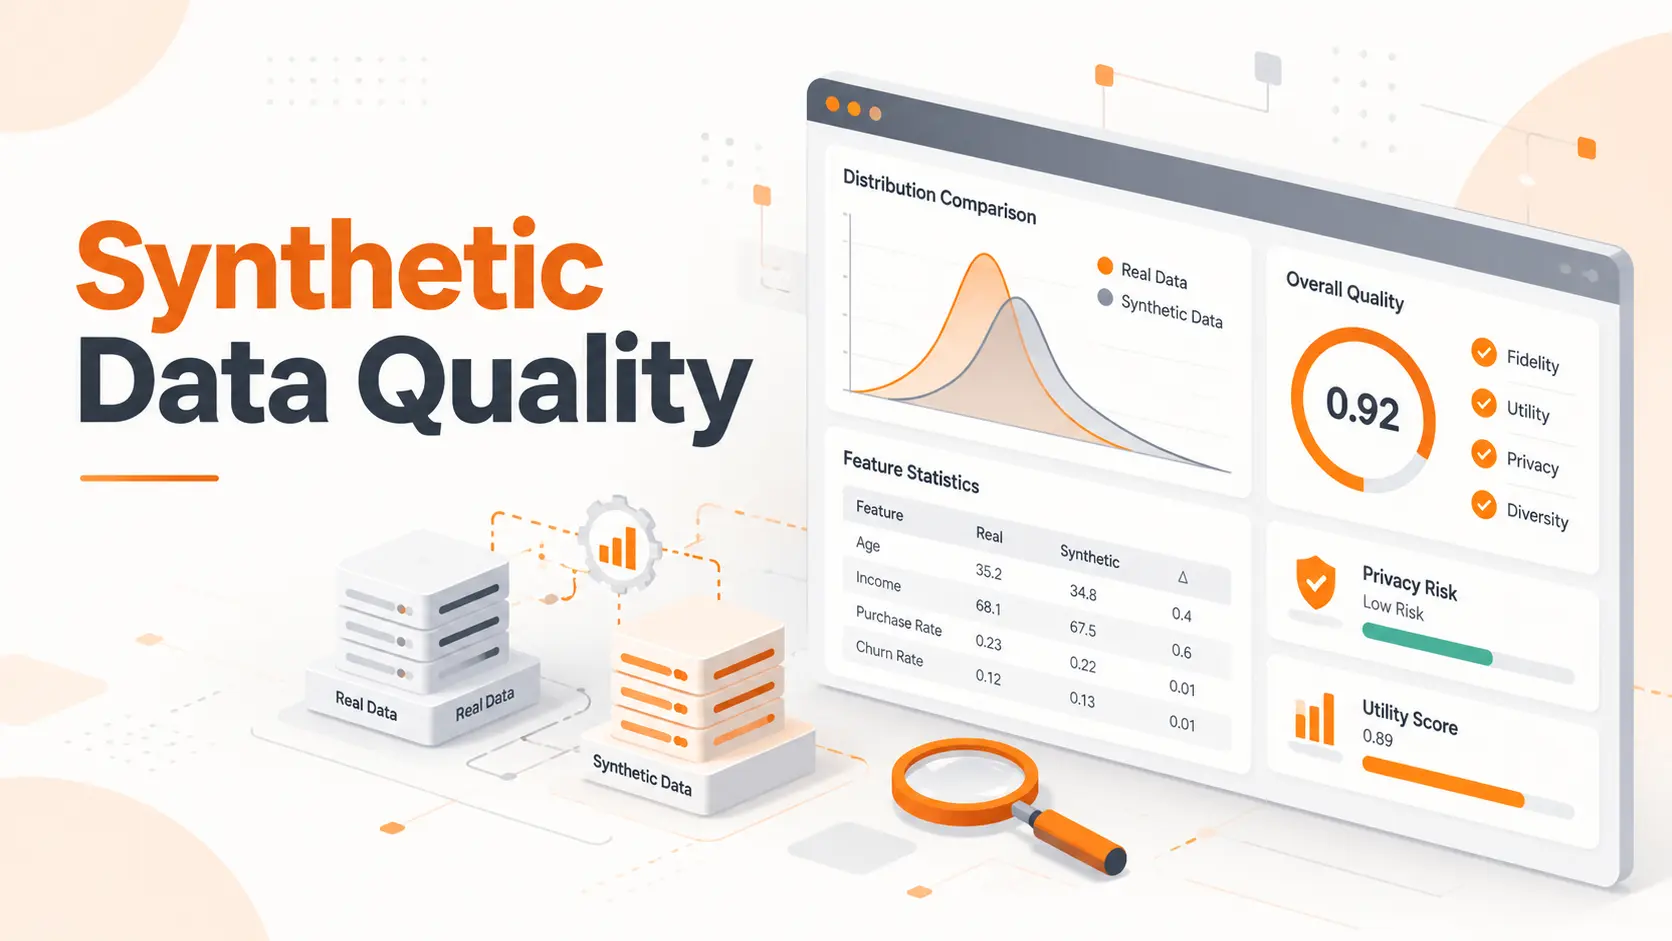
Synthetic data quality measures whether artificially generated data is accurate, useful, and safe enough for its intended purpose. A reliable evaluation examines three core dimensions: statistical fidelity, downstream utility, and privacy. The dataset must also satisfy structural and logical requirements before it can be used for AI training, analytics, or software testing.
When evaluating Synthetic Data, I focus on one question: Will this dataset deliver reliable results in the application it was created for? A dataset can look almost identical to real data and still produce inaccurate predictions. That is why I examine actual performance alongside statistical similarity rather than accepting a high quality score at face value.
How to Evaluate Synthetic Data Quality
The evaluation should begin before the synthetic records are generated. I establish the intended use, identify the relevant performance metrics, and reserve independent real data for validation.
This creates a reliable basis for determining whether the generated records are suitable for the project.
1. Define the Evaluation Objective
The first step is deciding what the synthetic dataset must accomplish.
A dataset created for testing database transactions has different requirements from one used to train a fraud detection model.
For software testing, valid data types, business constraints, relational integrity, and coverage of important scenarios take priority.
For machine learning, the dataset must preserve the patterns that influence predictions. Statistical similarity matters, but the final assessment must include model performance.
I define measurable acceptance criteria before examining the generated output. This prevents a high score on an unrelated metric from influencing the decision.
2. Separate Real Training and Evaluation Data
A reliable quality assessment requires reference data that the synthetic generator has not learned from.
I divide the available real data before fitting the generator. One portion is used to train the generator, another supports model selection and validation, and an independent test set remains untouched until the final evaluation.
This separation prevents data leakage.
If the generator has already seen the records used for evaluation, its output can appear more representative than it actually is.
I also compare natural differences between real-data partitions. Real datasets collected from the same population are not statistically identical, and those differences provide useful context when interpreting synthetic data quality scores.
3. Validate the Generated Records
Before measuring statistical similarity, I verify that the generated data satisfies basic requirements.
For structured datasets, this includes correct column types, valid categories, expected value ranges, unique identifiers, and relationships between connected tables.
A customer record with an impossible account date or an order referencing a nonexistent customer should fail the applicable validation check.
These issues should be resolved before using the records in downstream applications.
4. Measure Quality Against the Intended Task
After structural validation, I evaluate fidelity, utility, and privacy independently.
Each dimension answers a different question. A dataset that performs well on one does not automatically satisfy the others.
Synthetic Data Quality Metrics
The following metrics provide a practical reference for selecting and interpreting synthetic data quality tests.
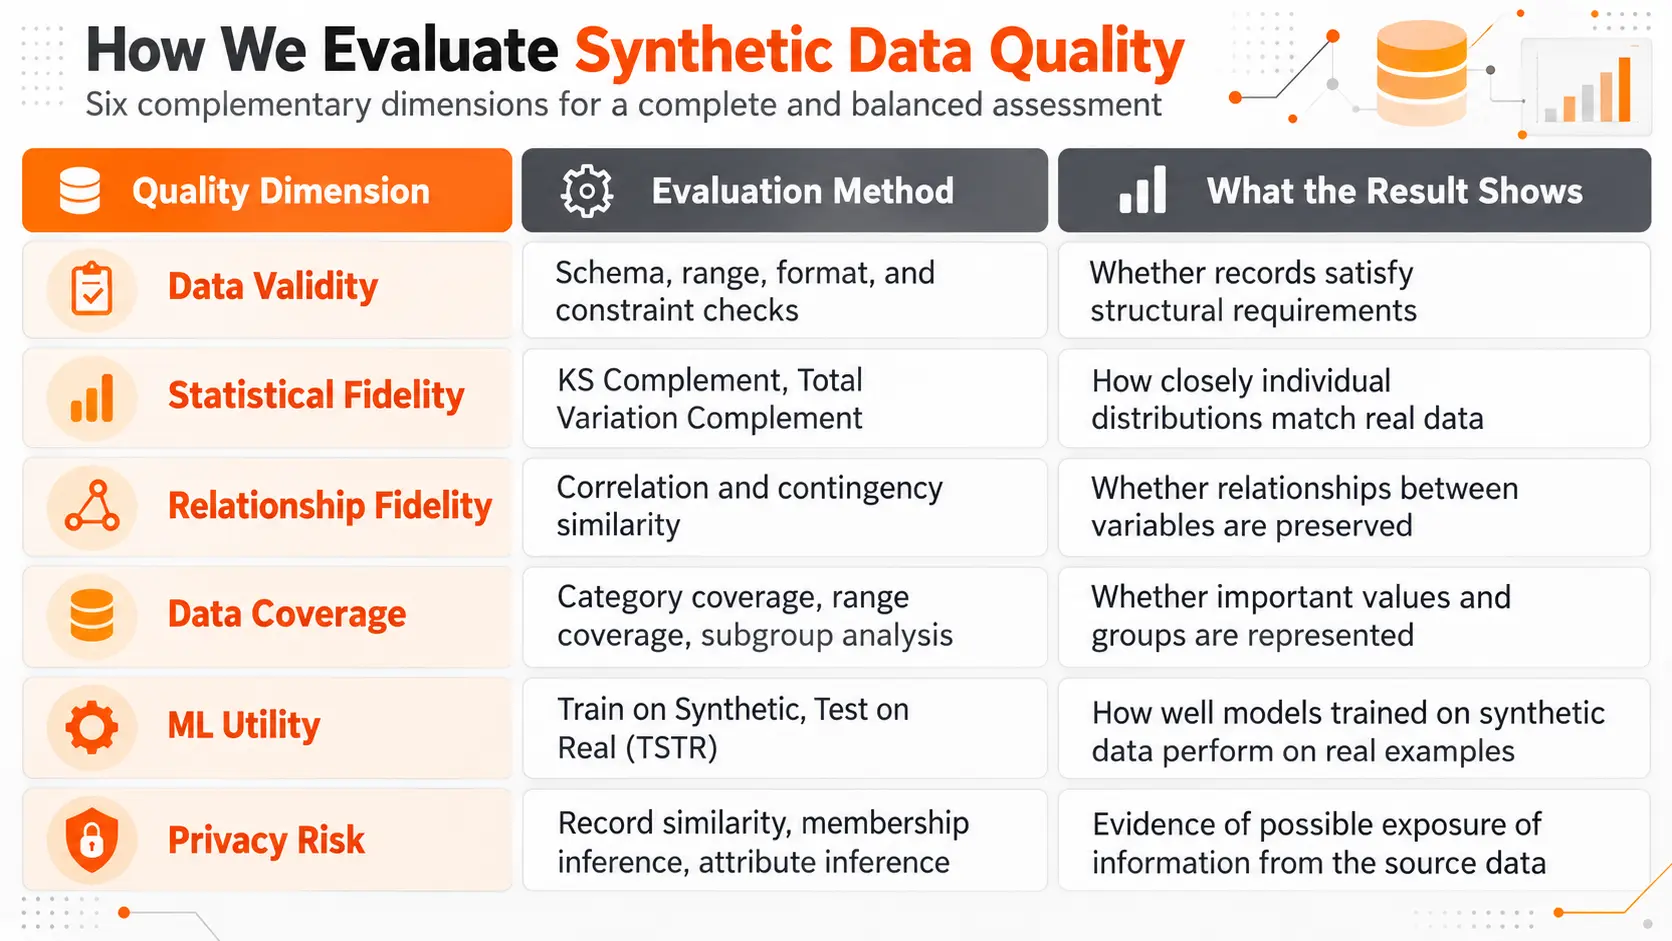
I use this table to choose the relevant tests rather than calculate every available metric.
For example, a synthetic dataset intended for regression modeling needs reliable relationships between predictive features and the target variable. A dataset designed for application testing instead needs strong structural validity and coverage of required scenarios.
The metrics should reflect those differences.
Statistical Fidelity and Data Similarity
Statistical fidelity measures how closely synthetic data reproduces the statistical characteristics of real data.
For numerical columns, I examine distributions, percentiles, ranges, and measures of central tendency.
For categorical columns, I compare the proportions of individual categories.
The Kolmogorov-Smirnov statistic measures the maximum difference between two empirical cumulative distributions. SDMetrics provides KSComplement, which transforms this difference into a similarity score where higher values indicate greater similarity.
For categorical features, TVComplement compares category distributions using the complement of Total Variation Distance.
These metrics identify distribution differences, but they do not establish whether the synthetic dataset preserves every meaningful pattern.
Relationships Between Variables
A synthetic dataset can reproduce the distribution of each column while failing to preserve dependencies between them.
Consider a dataset containing customer age, monthly income, subscription type, and spending.
Even if the generated ages and incomes match the original distributions, the relationships between income and spending can still be incorrect.
Correlation Similarity helps assess numerical relationships. Contingency-based metrics evaluate associations involving categorical features.
I also examine relationships involving three or more variables when they matter to the application. Matching pairwise correlations does not establish that higher-order relationships have been preserved.
Coverage of Rare Events
Rare events deserve separate evaluation because aggregate quality scores can conceal their absence.
For example, a fraud detection dataset can reproduce the overall transaction distribution while underrepresenting fraudulent transactions.
A model trained on those records would receive insufficient evidence of the behavior it needs to detect.
I compare category coverage, minority-group representation, and the characteristics of rare cases directly.
A strong average quality score should never replace an evaluation of the records that matter most to the task.
Data Utility and Machine Learning Performance
Data utility measures whether synthetic records produce useful results in their intended application.
For machine learning, I rely on downstream performance rather than statistical similarity alone.
One established evaluation method is Train on Synthetic, Test on Real (TSTR).
In this experiment, a model is trained exclusively on synthetic examples and then evaluated against an independent real test set.
Its performance is compared with Train on Real, Test on Real (TRTR), where a comparable model is trained on real examples and evaluated using the same real test set.
The models should use compatible architectures, evaluation procedures, and comparable training budgets.
Interpreting TSTR Results
Suppose a synthetic customer dataset has strong distribution similarity scores, but a churn prediction model trained on it performs poorly against real customer records.
This result indicates that the synthetic data has not preserved enough information for the intended predictive task.
The problem could involve missing relationships between features, inaccurate target labels, weak coverage of important groups, or a mismatch between the generated records and the test population.
The appropriate response is to investigate those specific weaknesses instead of immediately generating more records.
For classification, I use precision, recall, and F1 score. For regression, I select metrics such as MAE or RMSE according to the prediction objective.
The most informative result is the difference between models evaluated under comparable conditions.
Utility for Non-Predictive Applications
Machine learning metrics are not appropriate for every synthetic data project.
For analytical workloads, I compare important aggregates, query results, and relationships between variables.
For software testing, I assess whether the records exercise required application behavior, database constraints, and edge cases.
A dataset can have limited predictive utility and still be valuable for testing a software system. Quality must be judged against its intended use.
Privacy and Disclosure Risk
Synthetic data is not automatically anonymous.
A generator trained on sensitive information can reproduce individual records or reveal information about the people represented in its training set.
I evaluate privacy separately from statistical quality because a dataset can preserve useful patterns while still exposing confidential information.
Record Similarity and Memorization
The first privacy check examines whether synthetic records are identical or unusually similar to training records.
Exact duplicates deserve investigation, particularly when they contain sensitive information.
Nearest-neighbor analysis provides additional evidence by measuring the distance between synthetic records and real records.
I compare these distances with those observed between independent real-data samples. This helps distinguish ordinary similarity from patterns that suggest memorization.
However, record distance alone cannot establish complete privacy protection.
Privacy Attacks
Membership inference attacks attempt to determine whether a particular record was included in the generator's training data.
Attribute inference attacks examine whether information about an individual can be inferred from available records and background knowledge.
These assessments provide evidence about disclosure risks that statistical similarity scores cannot capture.
Differential privacy offers formal privacy guarantees when the generation mechanism is correctly implemented and its privacy parameters are documented.
A generator that simply produces artificial records does not provide those guarantees.
A dataset should not be approved for external sharing solely because it contains no obvious names or identifiers.
Interpreting Synthetic Data Quality Scores
A synthetic data quality score is meaningful only within the evaluation framework that produced it.
For example, an SDMetrics Quality Report assesses statistical properties such as column distributions and relationships.
A score of 90% in that report does not mean the synthetic dataset provides 90% predictive accuracy, preserves 90% of private information securely, or is suitable for every application.
It describes performance on the statistical measurements included in that report.
I examine the individual metric results before considering an overall score.
If column distributions receive high scores but important feature relationships perform poorly, the overall result can conceal a weakness that matters to the project.
Establishing Acceptance Criteria
There is no universal quality score that makes every synthetic dataset acceptable.
I establish acceptance criteria based on the application.
For an ML dataset, these criteria can include a minimum acceptable F1 score relative to a real-data baseline, performance requirements for important subgroups, and privacy conditions.
For software testing, mandatory database constraints can require complete compliance, while statistical similarity has a lower priority.
I also distinguish between exploratory and production uses. A dataset suitable for an internal prototype does not automatically meet the requirements for training a production model or sharing information outside an organization.
The decision must be supported by the relevant measurements.
Synthetic Data Quality Assessment Tools
Several tools provide structured approaches to synthetic data quality evaluation.
SDMetrics
SDMetrics offers statistical quality metrics, diagnostic checks, and reports for structured synthetic datasets.
Its Quality Report measures statistical similarity, while its Diagnostic Report examines properties such as data validity, structure, and applicable constraints.
The distinction is important. A statistically similar dataset can still contain invalid records, and a structurally valid dataset can still represent the source distribution poorly.
For tabular data, SDMetrics provides a useful framework for investigating individual columns and their relationships.
SDNist
SDNist is a synthetic data evaluation tool developed by the US National Institute of Standards and Technology.
It provides reports covering utility and privacy metrics within its supported evaluation datasets and workflows.
I would use it when the project's data and evaluation requirements align with the supported framework, rather than treating it as a universal evaluator for every synthetic dataset.
MOSTLY AI Quality Reports
MOSTLY AI provides quality assurance reports that compare synthetic and reference datasets.
Its evaluation approach includes comparisons of individual distributions, relationships between variables, and privacy-related measures.
These reports help identify the statistical areas where generated records differ from the reference data.
I treat automated reports as diagnostic evidence rather than final approval. The application still needs its own utility and risk assessment.
Improving Synthetic Data Quality
Improving synthetic data begins with identifying which evaluation dimension failed.
Changing the generation model without investigating the results can add computational cost without addressing the actual problem.
Low Statistical Fidelity
When synthetic and real distributions differ substantially, I inspect the source data, metadata, preprocessing rules, and generation method.
Incorrect column types and inconsistent transformations can distort the patterns learned by the generator.
I compare the affected columns before modifying the entire training configuration.
Poor Downstream Performance
If statistical similarity is strong but predictive performance remains weak, I investigate relationships involving the target variable.
The relevant issue is not whether the records look realistic. It is whether they preserve the information needed to make accurate predictions.
Targeted improvements to underrepresented patterns and training examples should then be evaluated against the same independent benchmark.
Missing Rare Categories
When important categories are absent, I examine their representation in the original dataset and the generator's sampling behavior.
Conditional generation and targeted sampling can help create additional examples for specified groups when supported by the method.
Those records still require validation to establish that the generated relationships remain credible.
Invalid Records and Business Constraints
Structural failures require direct corrections.
I review metadata definitions, validation rules, and supported generator constraints.
For relational datasets, primary keys, foreign keys, and required relationships must remain valid.
These conditions should be tested explicitly rather than inferred from statistical quality scores.
Excessive Privacy Risk
If privacy checks identify unacceptable disclosure risks, I would block external release and review the generation process.
Possible changes include stronger privacy controls, revising the training data, using a formally private generation mechanism, or limiting access to the resulting dataset.
After making changes, the complete privacy evaluation must be repeated.
Improving privacy can affect statistical fidelity and downstream utility, so all three dimensions need reassessment.
Synthetic Data Validation Across Different Data Types
Synthetic data quality cannot be measured identically across structured tables, text, and images.
For tabular synthetic data, column distributions, dependencies, valid relationships, and downstream predictive performance are central.
For synthetic text, evaluation must address factual accuracy, semantic relevance, instruction compliance, linguistic diversity, and the correctness of any generated labels.
A fluent response is not automatically a reliable training example. Human review or verified reference answers are needed for tasks where factual correctness is essential.
For synthetic images, visual realism alone is insufficient. Evaluation should include relevant image characteristics, label accuracy, variation across scenes, and performance on real images when the output is intended for computer vision training.
Across these formats, the central principle remains the same: the evaluation must measure properties that matter to the intended application.
Final Quality Assessment and Dataset Approval
Before approving a synthetic dataset, I consolidate the evaluation results into a decision record.
The record should identify the intended use, dataset version, generator configuration, reference-data split, validation results, privacy findings, and downstream performance.
I also preserve the acceptance criteria defined before generation.
This prevents the approval decision from shifting toward whichever metric produced the most favorable result.
A dataset is ready for its intended use when it satisfies the required structural checks, meets task-specific performance standards, and passes the applicable privacy review.
A high aggregate quality score is evidence worth examining. It is not a substitute for those conditions.
Conclusion
Synthetic data quality depends on more than statistical similarity. A reliable dataset must preserve the information needed for its intended task, satisfy structural requirements, and avoid unacceptable disclosure risks.
I consider evaluation complete only when the results support a clear decision about how the data will be used. By measuring fidelity, utility, and privacy separately, developers can identify weaknesses, improve generated records, and determine whether the dataset is suitable for real applications.
FAQ
Can I check synthetic data quality if I can't access the original dataset?
A limited evaluation is possible without direct access to the original records. Structural validity, business constraints, and selected application tests can be checked independently. Statistical fidelity requires access to suitable reference statistics or a secure evaluation process managed by an authorized data owner. Without a reference, fidelity cannot be established reliably.
What if my synthetic dataset doesn't have any labels?
An unlabeled dataset can still be evaluated for distributions, relationships, coverage, structural validity, and privacy risk. Predictive utility can be assessed through an appropriate unsupervised task, but supervised classification accuracy requires verified target labels. The evaluation method must match the available information.
Can I compare quality scores from two different synthetic data tools?
Direct comparison is valid only when the tools use equivalent metrics, reference datasets, preprocessing rules, and aggregation methods. Two products can report the same numerical score while measuring different properties. For a reliable comparison, evaluate their generated datasets using one common framework and the same reference data.
Do I need to check quality again every time I generate a new batch?
Yes. Each generated batch should pass the required acceptance checks before use. A previously validated generator does not guarantee that every new sample set satisfies the same requirements. Automated validation can make repeated checks practical, while changes to the generator or source distribution require broader reevaluation.
Can I publish synthetic data if it gets a high quality score?
A high statistical quality score does not establish permission to publish the dataset. Publication requires assessing disclosure risk, source-data rights, contractual obligations, and applicable privacy requirements. An authorized review is necessary before distributing synthetic records derived from restricted or sensitive information.

Fatemeh Jahangard
Technology & AI Writer at PinerookFatemeh Jahangard covers AI, emerging technologies, and digital innovation for Pinerook, focusing on how technology shapes startups and industries.
 Seen first.