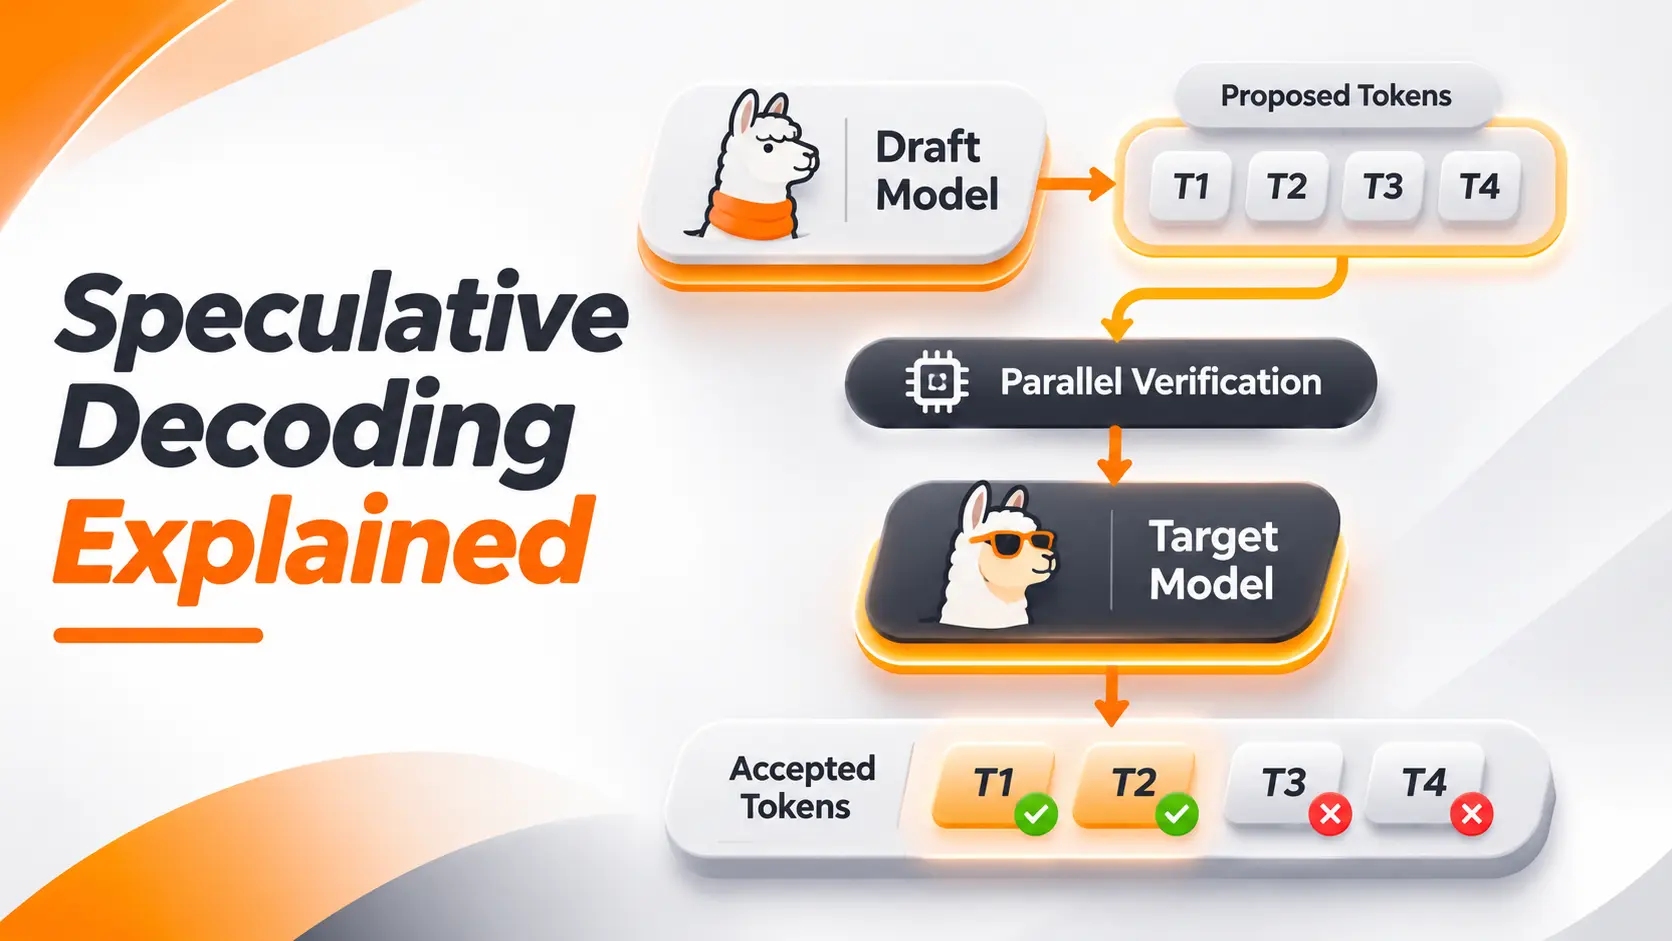
Permutation Feature Importance measures how much a machine learning model depends on each input feature for its predictive performance. It works by randomly shuffling the values of one feature and measuring how much the model's performance changes. A larger performance drop indicates greater reliance on that feature.
In Explainable AI, I find this method valuable because it measures the importance of features through actual model performance rather than internal model calculations. The result helps identify which inputs matter most to a trained model, which features contribute little to its predictions, and where further investigation is needed.
Permutation Feature Importance Example
Consider a machine learning model designed to detect fraudulent transactions.
The model uses transaction amounts, device history, login locations, and customer information to classify transactions as legitimate or suspicious.
Suppose the model achieves 90% accuracy on a validation dataset.
We want to understand which input features contribute most to that performance.
Permutation Importance evaluates each feature separately. It randomly rearranges the values within one column, keeps the other columns unchanged, and measures the model's accuracy again.
The following results are illustrative and are not measurements from an executed model.
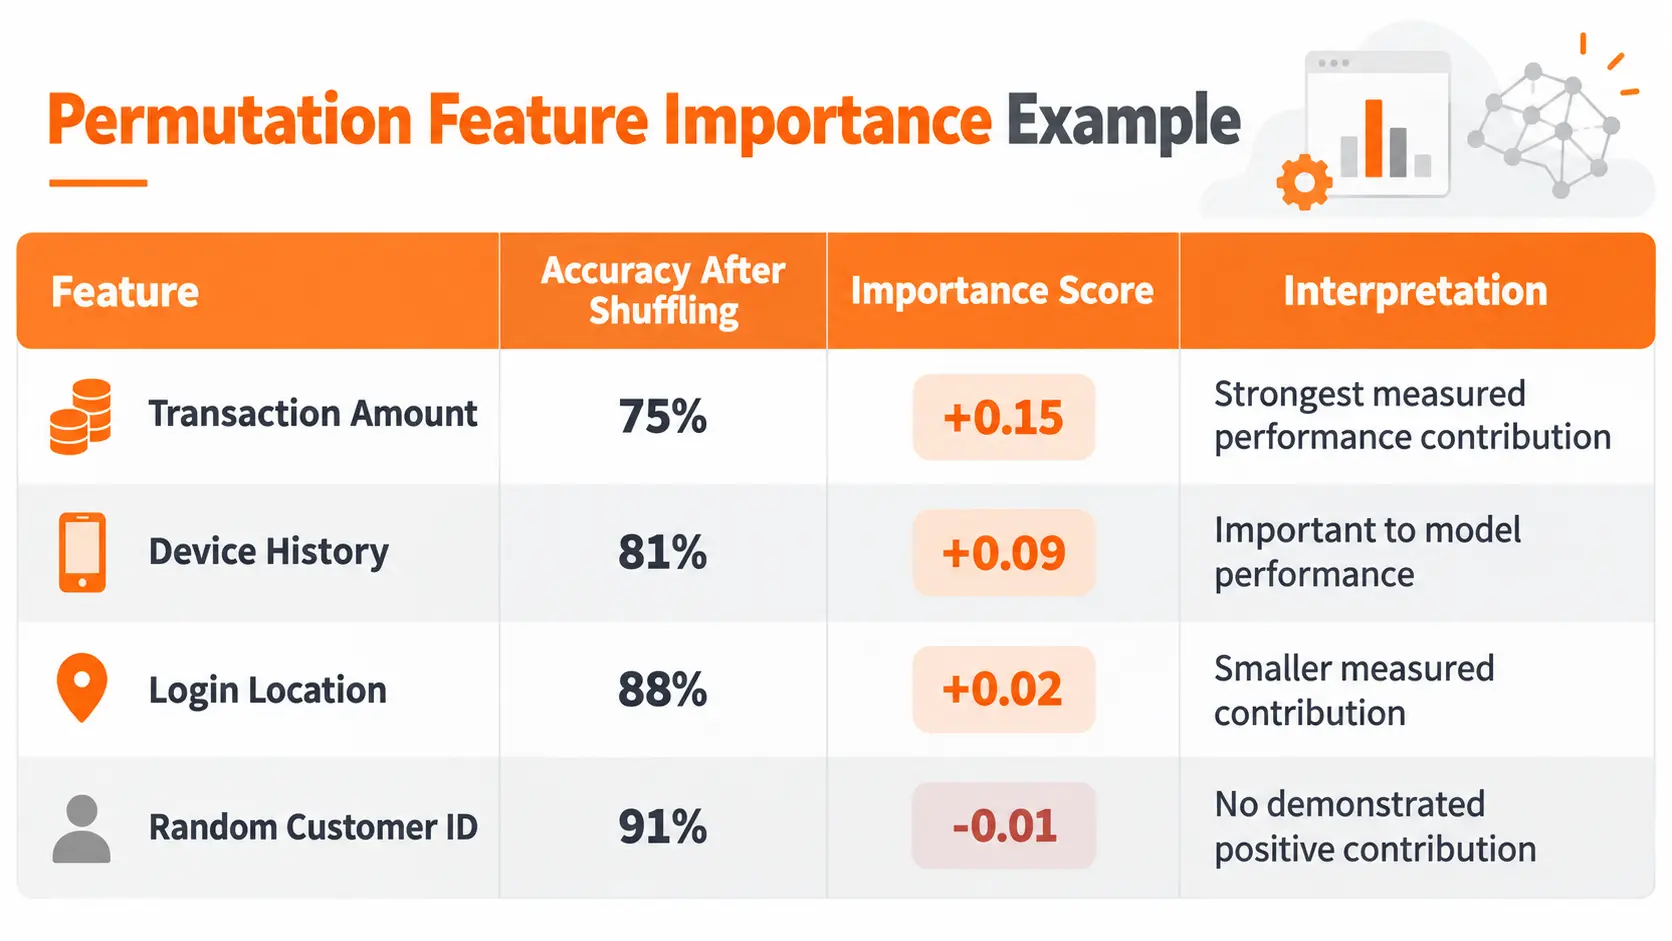
The baseline accuracy is 90%, and the importance score represents the difference between the original accuracy and the accuracy after shuffling.
For transaction amount, accuracy falls from 90% to 75%. That produces an importance score of 0.15, equivalent to a decrease of 15 percentage points.
The model loses less accuracy when device history is shuffled, indicating a smaller measured dependence on that feature.
Login location produces only a two percentage point decrease.
The random customer ID produces a negative importance score because the shuffled dataset achieves slightly better accuracy than the original.
I would not interpret that negative result as evidence that the customer ID actively harms the model. A small improvement can arise from random variation, and the result needs further evaluation.
The important finding is that Permutation Feature Importance measures how much predictive performance changes when information from a feature is disrupted.
It does not reveal whether increasing the feature raises or lowers an individual prediction.
How Permutation Feature Importance Works
Permutation Importance is a model agnostic interpretation method. It can evaluate different types of trained models because it measures their predictions rather than inspecting their internal structure.
The calculation follows a defined process.
Measuring Baseline Performance
The first step is to evaluate the trained model using an appropriate dataset and performance metric.
For the fraud detection example, the baseline accuracy is 90%.
This value establishes the reference against which the shuffled results will be compared.
I establish model performance before interpreting feature importance. If a classifier performs poorly on unseen data, identifying the features it relies on will not establish that its predictions are reliable.
Shuffling Individual Features
Next, select one feature and randomly rearrange its values across the evaluation observations.
For example, the transaction amount belonging to one customer can be assigned to another transaction.
The remaining feature columns and target labels stay unchanged.
This process disrupts the relationship between the selected feature and the information used by the model.
The trained model then evaluates the modified dataset.
The model itself is not retrained or modified.
Calculating the Performance Difference
After shuffling, the same performance metric is calculated again.
The importance score is the original model score minus the score obtained after shuffling.
For metrics where higher values indicate better performance, a larger positive difference means that disrupting the feature caused a greater performance loss.
The procedure is repeated for every selected feature.
Repeating the Permutations
One random shuffle does not provide a complete picture of how sensitive the result is to the selected feature.
Different arrangements of the same values can produce different performance scores.
Repeating the permutation provides several importance measurements for each feature.
The average describes its measured contribution, while the variation between repetitions shows how stable that estimate is.
I use repeated measurements rather than relying on a single shuffle when interpreting the final ranking.
Interpreting Permutation Importance Scores
A feature importance score only becomes meaningful when its evaluation metric and scale are known.
The same numerical result can represent different levels of performance change depending on the metric used.
Positive Importance Scores
A positive score means the model performed worse after the feature values were shuffled.
In our fraud detection example, transaction amount receives a score of 0.15.
That means removing the original association between transaction amounts and observations reduced accuracy by 15 percentage points in the illustrative evaluation.
This is evidence that the trained model relies on information carried by that feature.
However, a high score does not establish that the feature causes fraud or that it is the most important factor in the real world.
Importance Scores Near Zero
A score near zero means shuffling the feature produced little change in the selected performance metric.
There are several possible explanations.
The model might not use the feature in a meaningful way. The feature might contain information already provided by another variable. The chosen metric might also be insensitive to the prediction changes caused by shuffling.
I would examine these possibilities before treating the feature as unnecessary.
Low permutation importance does not automatically justify removing a feature.
Negative Importance Scores
A negative score means the model achieved a better evaluation score after the feature was shuffled.
In the example, the random customer ID has an importance score of negative 0.01.
That represents a one percentage point improvement after permutation.
I would repeat the measurement and examine the variation before drawing conclusions.
A consistently negative result can justify investigating whether the model has learned an unhelpful relationship. It does not prove that removing the feature will improve performance after retraining.
Permutation Feature Importance in Python
Python provides a practical implementation of Permutation Importance through Scikit Learn.
The library includes a function named permutation_importance within its model inspection functionality.
It works with fitted estimators that support the chosen evaluation metric.
For a Random Forest fraud detection model, I would follow the process below.
Preparing the Trained Model
Start with a dataset containing transaction characteristics and verified fraud labels.
Separate the observations into training and validation datasets.
Train the classifier using the training data, then evaluate its performance on the validation data.
The validation dataset should represent the transactions the model is expected to classify.
If the model performs well during training but poorly on validation data, the importance ranking from training records can describe relationships that do not generalize.
For this reason, I use independent evaluation data when the objective is to understand feature reliance beyond the training dataset.
Configuring the Permutation Evaluation
The Scikit Learn implementation requires the trained estimator, the feature dataset, and the associated target values.
It also allows the user to select the scoring metric, number of permutation repetitions, and random seed.
For fraud detection, I would choose a metric aligned with the application's actual objective rather than automatically relying on accuracy.
The number of repetitions should provide enough measurements to evaluate ranking stability.
A fixed random seed makes it easier to reproduce the permutation sequence under the same configuration.
Generating Feature Importance Results
After the calculation, Scikit Learn returns the importance values for each feature across the repetitions.
It also provides the mean importance and standard deviation.
I would arrange the features from the largest average performance decrease to the smallest.
This makes it possible to identify which columns the model relies on most strongly.
Before drawing conclusions, I would also inspect the variation across repetitions.
Two features with similar average scores and substantial variation should not be presented as having a definitive importance ranking.
Reading a Permutation Importance Plot
A Permutation Importance Plot turns the calculated scores into a visual ranking.
The vertical axis lists the model features. The horizontal axis shows the decrease in the selected evaluation score after permutation.
Features with larger positive values appear farther along the positive direction of the axis.
For the fraud detection example, transaction amount would have the longest positive bar, followed by device history and login location.
The random customer ID would appear near zero on the negative side.
When repeated permutations are used, error bars can display the variation across those repetitions.
I read the chart in three stages.
First, I identify the features associated with the largest performance decreases.
Next, I inspect whether their scores are substantially different or overlap within the observed variation.
Finally, I examine the features near zero and consider whether correlations or the evaluation metric could explain their low scores.
An importance plot is a ranking of model reliance, not a chart showing whether features increase or decrease predictions.
That distinction matters when interpreting results for business decisions.
Choosing Evaluation Metrics and Permutation Repeats
Permutation Importance depends directly on the metric used to evaluate model performance.
Different metrics can produce different rankings for the same trained model.
Accuracy, F1 and ROC AUC
Accuracy measures the proportion of correct classifications.
For a balanced classification problem with similar costs for different errors, it can provide a useful performance summary.
Fraud detection creates a different problem because fraudulent transactions can represent a small fraction of all transactions.
A classifier that predicts nearly every transaction as legitimate can achieve high accuracy while failing to identify suspicious activity.
I would therefore examine metrics such as recall, precision, F1, ROC AUC, or average precision according to the application's requirements.
For example, a feature might contribute little to overall accuracy but substantially improve the detection of fraudulent transactions.
Its permutation importance will reflect the metric selected.
There is no single importance ranking independent of the performance objective.
Regression Metrics
Permutation Feature Importance also works with regression models.
For a house price prediction model, the evaluation can use R² or an error based metric such as Mean Absolute Error.
When using an error measure, the interpretation must account for whether smaller or larger values represent better performance.
Scikit Learn uses scoring conventions designed around higher scores being better, including negative versions of certain error metrics.
The displayed importance should always be interpreted according to the selected scoring definition.
Stability Across Repetitions
Increasing the number of repetitions provides more measurements of the effect of shuffling each feature.
I would review the average importance alongside its variation.
If the scores of two features change substantially across repetitions, their relative ranking is not stable enough to justify a strong conclusion.
More repetitions improve the assessment of permutation variability, but they do not remove problems caused by correlated features or an inappropriate evaluation dataset.
Permutation Importance vs Random Forest Importance
Random Forest models provide an internal feature importance measure based on how features contribute to reducing impurity during tree construction.
This method is commonly called Mean Decrease in Impurity, or MDI.
Permutation Importance takes a different approach.
Instead of examining the model's internal tree splits, it measures what happens to predictive performance when a feature is shuffled.
The distinction has practical consequences.
Impurity Based Feature Importance
Impurity based importance is calculated from the fitted trees.
It is computationally convenient because the values can be obtained directly from the trained Random Forest.
However, this measure can favor features with many possible values.
A numerical variable containing numerous unique values can receive a high impurity importance score even when it does not provide useful predictive information on unseen data.
This makes the method vulnerable to misleading rankings, particularly when the model has overfitted the training records.
Permutation Based Feature Importance
Permutation Importance evaluates the model using a selected dataset and performance metric.
It can therefore be calculated on validation data rather than relying only on the information recorded during model training.
It also works with models beyond Random Forest, including gradient boosting, neural networks, and other predictive estimators.
I prefer permutation based evaluation when the objective is to understand which features support performance on independent observations.
However, it is not free from interpretation problems.
Correlated features and unrealistic shuffled combinations can still affect the results.
Correlated Features and Permutation Importance
Feature correlation is one of the most important considerations when interpreting Permutation Importance.
Two features can provide overlapping information to a model.
For example, a fraud detection dataset might contain both the number of transactions completed during the last hour and the number completed during the last sixty minutes.
These features describe the same period and can carry nearly identical information.
If one is shuffled, the model can still access similar information through the other.
As a result, neither feature has to receive a large individual importance score, even when the information they contain is valuable.
Shared Predictive Information
This problem becomes more serious when several correlated features appear in the same model.
Scikit Learn demonstrates a case using the Wisconsin breast cancer dataset where a Random Forest achieves strong predictive accuracy, yet individual permutation importance scores are small because of correlated inputs.
The model remains effective because it can obtain related information from multiple features.
A low score therefore needs to be interpreted in the context of the other available variables.
Unrealistic Feature Combinations
Shuffling one feature independently also breaks its original relationships with other features.
Consider a property valuation model containing floor area and bedroom count.
Rearranging floor area while leaving bedroom counts unchanged can create unrealistic combinations.
The model is then evaluated on inputs that are poorly represented in the original data.
These predictions influence the resulting importance score.
I would inspect feature dependencies before treating the ranking as a reliable summary of model behavior.
Evaluating Related Features Together
When several features contain overlapping information, grouped permutation provides another perspective.
Instead of disrupting one column, the method disrupts a related group and measures the resulting performance change.
This can reveal reliance on information shared across multiple features.
Conditional permutation methods offer another approach by attempting to preserve dependencies while modifying the selected feature.
These methods answer different questions from standard permutation importance and require additional assumptions.
For a practical investigation, I would start by examining feature correlations and then choose the method that matches the question being asked.
Permutation Importance for Feature Selection
Permutation Feature Importance can help identify candidates for feature removal, but the ranking is not a complete feature selection procedure.
Consider a model containing twenty input variables.
If several features produce negligible changes in validation performance after permutation, it is reasonable to investigate whether they are necessary.
I would begin by examining their relationships with other features and checking whether the low scores remain stable across repetitions.
Next, I would train a new model without the selected features.
The new model must be evaluated independently because removing a feature changes the information available during training.
A feature that appears unimportant to the original model can become valuable after another correlated feature is removed.
I would compare the revised model's predictive performance, training cost, inference requirements, and stability with the original model.
The final decision should be based on those results rather than the permutation ranking alone.
This is particularly relevant when reducing model complexity or removing expensive data collection requirements.
Practical Uses of Permutation Feature Importance
Permutation Feature Importance supports several tasks during model development and evaluation.
In fraud detection, it helps identify which transaction characteristics contribute most to predictive performance.
In customer churn prediction, it shows which customer attributes the model relies on when distinguishing customers likely to leave.
In forecasting and risk modeling, it can reveal reliance on variables that deserve closer inspection.
It is also useful when comparing two versions of a model.
A newer model might achieve better overall performance while relying on a different set of features.
I would calculate importance using a consistent evaluation dataset and scoring metric to examine those differences.
A major change in feature rankings can prompt investigation into changes in the training data, model configuration, or learned relationships.
However, the ranking does not establish that the features are causally responsible for the real world outcomes being predicted.
Conclusion
Permutation Feature Importance provides a practical way to measure how strongly a trained machine learning model depends on individual features for its predictive performance.
By comparing the original evaluation score with the score after shuffling each feature, it produces an interpretable ranking of model reliance.
I consider the method most useful when the evaluation metric reflects the actual task, the scores are measured across repeated permutations, and relationships between features are examined before interpreting the ranking.
A high score shows that disrupting a feature reduces model performance. A low score requires further investigation before the feature is considered unnecessary.
The goal is not simply to identify the highest ranking variable. It is to understand which information the model relies on and whether that reliance supports reliable predictions.
FAQ
Can I calculate permutation importance without knowing the correct labels?
Standard permutation importance for supervised learning requires the true target values because it measures changes in predictive performance. Without labels, accuracy, F1, and similar supervised metrics cannot be calculated. An alternative evaluation objective would need to be defined, but its importance scores would answer a different question.
Can I use permutation importance with a model running through an API?
Yes. The method can evaluate an externally hosted model if the API accepts the modified inputs and returns predictions required by the scoring metric. The implementation must preserve input formats and feature definitions. API latency, request limits, and inference costs can make repeated evaluations expensive.
What happens if my categorical feature has been converted into several columns?
When categorical variables are represented through one hot encoding, each encoded column represents part of the original feature. Shuffling those columns independently can create invalid category combinations. Evaluating the original categorical feature before preprocessing or permuting the related encoded columns as a coordinated group provides a more meaningful analysis.
Can I use permutation importance for time series forecasting?
Yes, but independent random shuffling can destroy temporal relationships that are essential to forecasting. The evaluation procedure must respect the time ordering of the data and the forecast horizon. Block permutation or other time aware approaches can help evaluate the importance of temporal information without treating sequential observations as independent.
Will my feature importance scores stay the same after the model goes live?
No fixed ranking is guaranteed across different data distributions. Permutation Importance depends on the trained model, evaluation dataset, and performance metric. If production data changes over time, the measured importance scores can change even without retraining the model. New evaluations are needed to understand how feature reliance changes under updated operating conditions.

Fatemeh Jahangard
Technology & AI Writer at PinerookFatemeh Jahangard covers AI, emerging technologies, and digital innovation for Pinerook, focusing on how technology shapes startups and industries.
 Seen first.