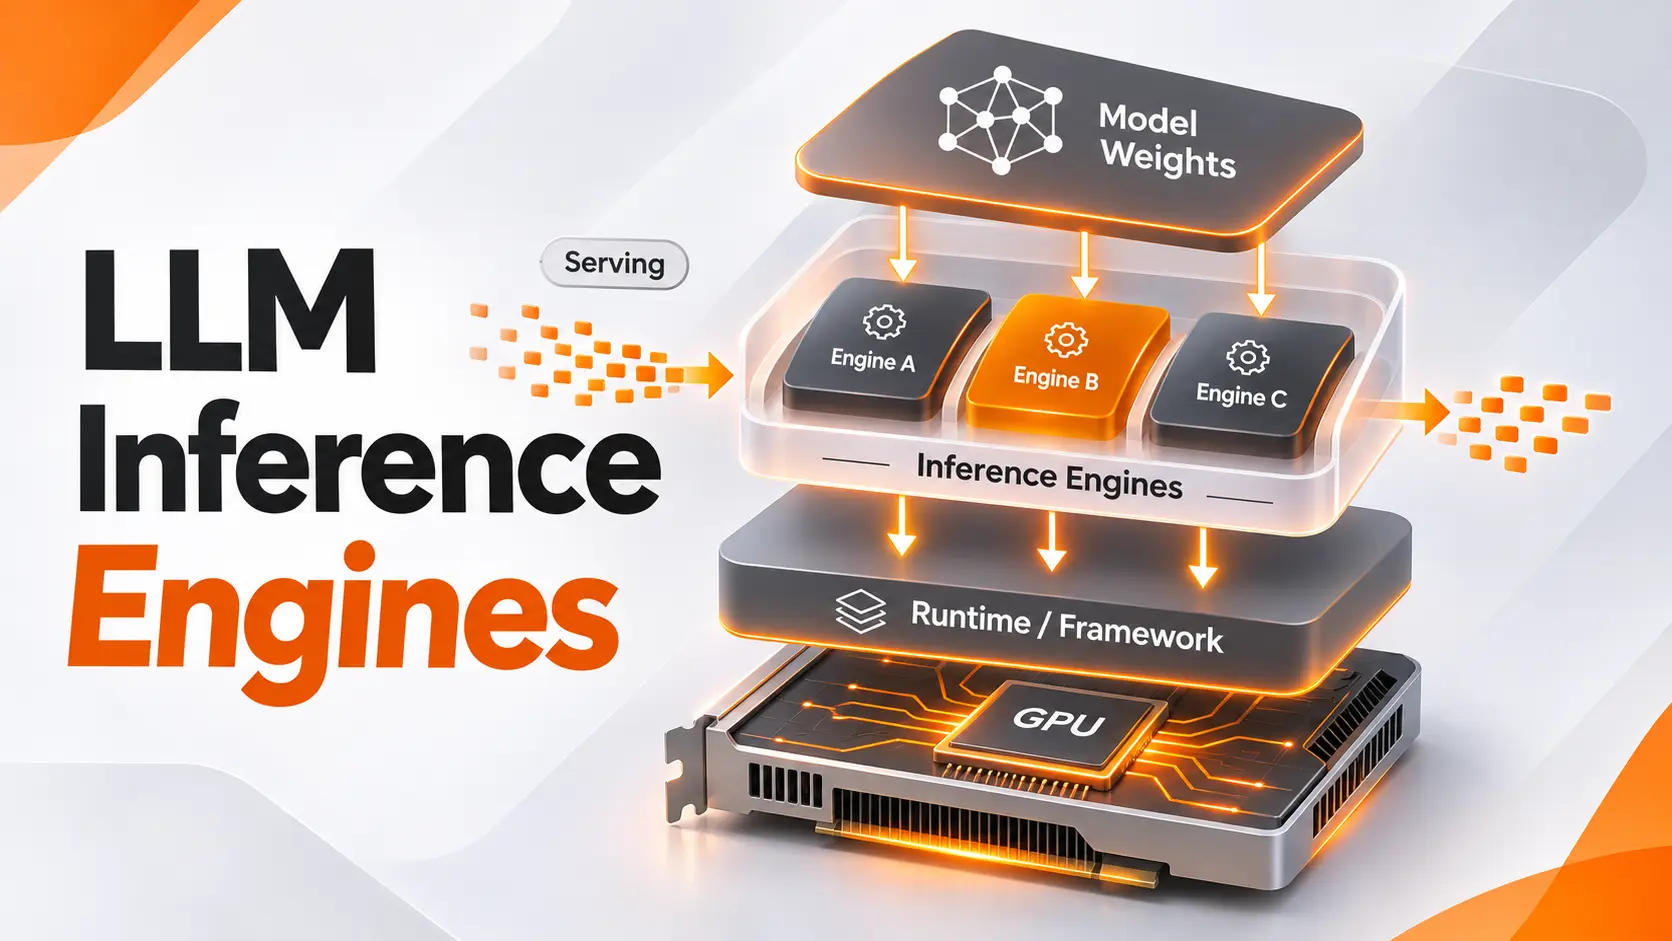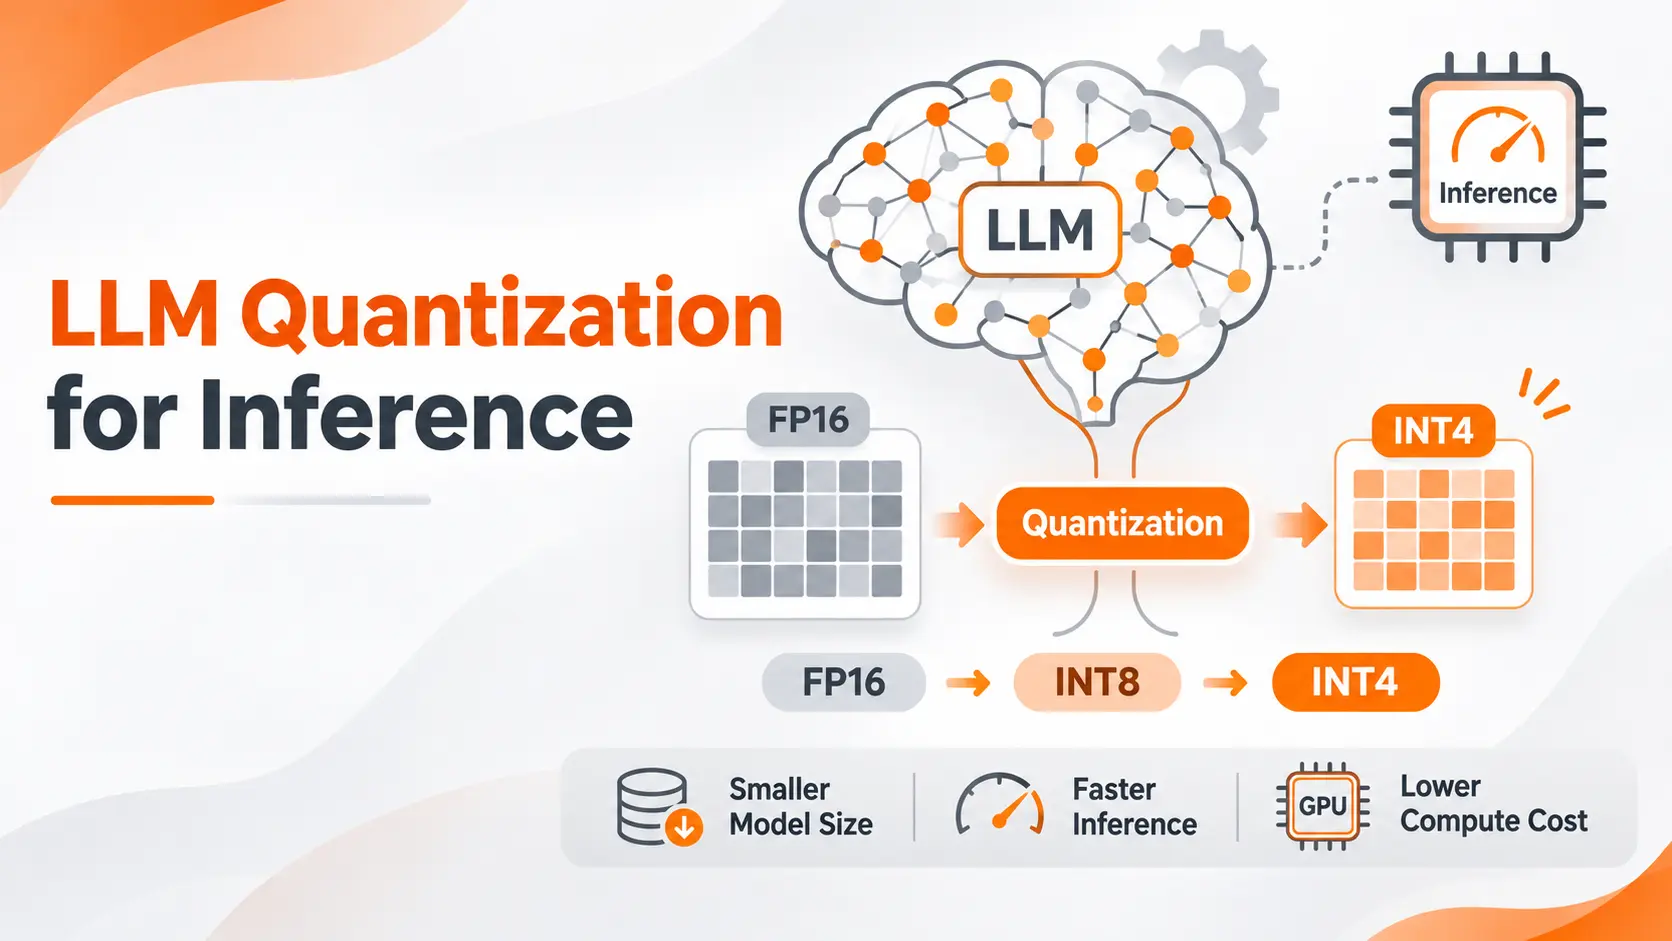
LLM inference benchmarking measures how efficiently a language model serves requests under a defined workload. A reliable benchmark examines time to first token, token generation speed, total response latency, throughput, and performance under concurrent traffic. The goal is to identify how much work an inference system can handle without exceeding its latency and reliability requirements.
A model that generates 100 tokens per second in isolation can deliver a poor experience when multiple users submit requests together. This is why I judge inference performance using realistic workloads and measurable service targets rather than a single advertised speed.
LLM Inference Benchmarking Methodology
The most useful benchmark answers a practical question: how much traffic can this deployment process while maintaining acceptable response times?
I approach LLM inference benchmarking as a controlled experiment. The model, serving environment, workload, and measurement boundaries must be documented before performance numbers can support a decision.
The workflow follows six steps:
Define the performance target. Establish the maximum acceptable time to first token, response latency, error rate, and expected request volume.
Prepare a representative workload. Select prompts that reflect actual application traffic, including input lengths, expected output lengths, and generation settings.
Fix the test environment. Record the model version, GPU configuration, inference engine, precision, tokenizer, and relevant serving settings.
Warm up the deployment. Complete initial requests before collecting benchmark measurements to separate startup behavior from steady operation.
Increase the traffic load. Measure performance across several concurrency levels and request arrival rates rather than relying on a single test.
Repeat and compare results. Collect independent measurements for each configuration and examine latency distributions, throughput, and failures.
The distinction between a controlled benchmark and a production workload matters. A controlled test isolates performance differences. A production simulation establishes whether those differences improve the application people use.
Both measurements are valuable, but they answer different questions.
Benchmark Workload Design
Input length, output length, and traffic distribution determine how much work the inference server performs.
A summarization request containing 8,000 input tokens places different demands on the system than a chatbot request containing 300 tokens. The first requires more prompt processing, while a request generating a long response places greater emphasis on decoding performance.
For a practical comparison, I separate workloads into three categories:
Short conversational requests: Use compact prompts and responses to evaluate interactive applications where users expect immediate feedback.
Long context requests: Use large prompts representing document analysis, retrieval augmented generation, and extensive conversation histories. These expose prompt processing costs and memory pressure.
Long generation requests: Use requests requiring substantial output, such as technical explanations or code generation. These reveal sustained decoding performance.
For each category, preserve the actual distribution of input and output lengths. A maximum generation limit is not evidence that the model generated that number of tokens.
The benchmark must also account for prefix caching. Repeating identical prompts can produce favorable results when cached prefixes eliminate work that independent production requests would require. I use separate configurations for cold cache performance and repeated context workloads, with each cache condition clearly identified.
This distinction matters within LLM Inference Optimization because a configuration that performs well with reusable prompts does not establish equivalent performance for unrelated requests.
LLM Inference Benchmark Metrics
A useful performance report connects every metric to a decision. Time to first token describes initial responsiveness, while output throughput measures the aggregate generation capacity of the system. Neither provides a complete performance assessment independently.
The following table summarizes the measurements I would retain in an inference benchmark report.
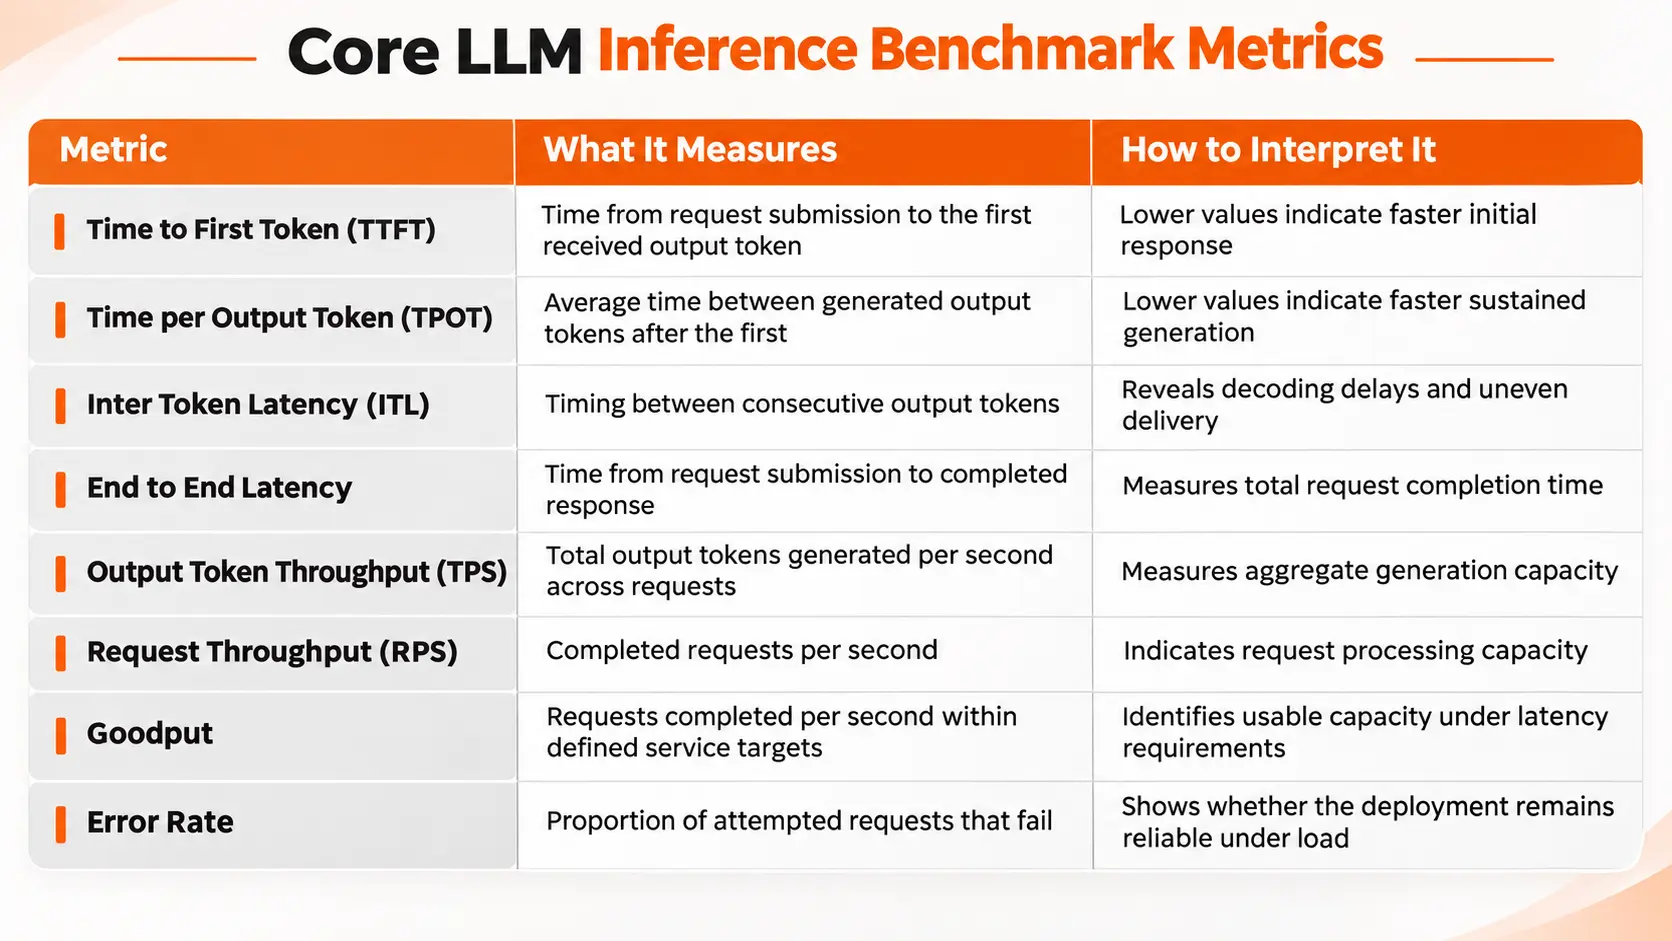
The distinction between TPOT and ITL deserves attention. TPOT summarizes the average delay across the decoding portion of a request. Individual token intervals provide additional information about generation consistency. Benchmark tools differ in how they calculate and report these measurements, so their definitions must match before comparing results.
Consider a response containing 101 tokens. If the first token arrives after one second and the complete response arrives after six seconds, the remaining 100 token intervals occupy five seconds.
The average TPOT is 50 milliseconds, corresponding to 20 output tokens per second after the first token.
That calculation describes one request. It does not establish the total throughput of a server handling multiple requests simultaneously.
Latency Percentiles
Average latency cannot describe the complete user experience.
I examine P50, P95, and P99 latency to understand how response times are distributed. P50 represents the median, P95 marks the value at or below which 95% of measured requests fall, and P99 exposes a more extreme portion of the latency distribution.
A deployment can report a strong median while delivering unacceptable response times to users in the slower tail.
For interactive applications, P95 TTFT and P95 total latency provide useful service targets. Percentile measurements require sufficient request samples, and small test runs cannot support dependable conclusions about extreme tail latency.
LLM Inference Benchmarking Tools
The right benchmarking tool depends on whether the objective is to measure a serving engine, evaluate an API endpoint, or compare standardized hardware performance.
vLLM Bench Serve
vLLM provides a serving benchmark that sends requests to an inference endpoint and records performance under configurable traffic conditions.
It supports controlled input and output lengths, request rates, concurrency limits, datasets, and latency measurements. This makes it useful when comparing inference engine configurations or testing an OpenAI compatible serving interface.
I would select vLLM Bench Serve when the main objective is to measure an actual model serving endpoint rather than isolated model execution.
The distinction matters because offline throughput benchmarks do not measure the complete request serving path, including network and scheduling behavior.
NVIDIA AIPerf
NVIDIA AIPerf measures generative model performance through serving endpoints. It supports synthetic and dataset based workloads, streaming measurements, configurable concurrency, request arrival patterns, and performance reporting.
It is suitable for evaluating different deployment configurations across multiple load levels.
AIPerf also supports goodput measurements against specified service objectives. This helps identify how much useful traffic the system processes while remaining within performance limits.
NVIDIA now recommends AIPerf for new benchmarking work as GenAI Perf is being phased out.
MLPerf Inference
MLPerf Inference provides standardized benchmarks for comparing AI inference systems using defined workloads, accuracy requirements, and performance scenarios.
The MLPerf Inference 6.1 suite includes language model benchmarks with Server, Offline, and Interactive scenarios for applicable models.
I would use MLPerf results when evaluating hardware capabilities or standardized system comparisons. They do not replace application specific benchmarking because the workload, serving configuration, and performance requirements of an individual deployment differ from those of a standardized test.
Benchmarking Concurrent Requests and Throughput
Concurrency determines how many requests are active simultaneously. Request rate describes how frequently new requests enter the system.
These variables influence performance differently.
A concurrency controlled benchmark maintains a specified number of active requests. When one request finishes, the client can submit another to keep that concurrency level.
A request rate controlled benchmark schedules incoming requests at a specified rate, independently of how quickly earlier requests finish.
For a production facing service, I prioritize request rate tests because incoming traffic does not stop simply because the inference server becomes busy.
As demand increases, the server can accumulate queued requests. Throughput may reach a plateau while latency continues rising. Once incoming demand exceeds sustainable processing capacity, the queue can grow and requests can exceed their response time limits.
This is where goodput becomes more informative than maximum throughput.
A deployment that produces more tokens but misses its latency requirements is not delivering more usable capacity for the target application.
The performance limit I care about is therefore the highest sustainable request rate that satisfies the defined latency and reliability thresholds.
Comparing Models, GPUs, and Inference Engines
A fair LLM inference performance comparison requires matching the workload and defining which configuration variables are allowed to change.
Model Performance Comparisons
When comparing different language models, identical prompts do not guarantee identical computational work. Models use different tokenizers, architectures, and generation behavior.
I compare completed tasks, response quality, latency, and cost against the same evaluation dataset. Token throughput remains useful within each model, but it should not be treated as a universal performance ranking across different tokenization schemes.
A faster model is not a better choice if its output fails the application's quality requirements.
GPU Performance Comparisons
For GPU comparisons, keep the model, precision, serving engine, and request workload consistent.
Record GPU memory capacity, memory utilization, processing topology, and the number of accelerators used by each deployment.
The goal is to determine the performance gained from the hardware change rather than introducing unrelated software differences.
Hardware utilization should be examined alongside latency and throughput. High GPU utilization is not itself evidence of efficient inference when the service cannot meet its response time targets.
Inference Engine Comparisons
Comparing engines such as vLLM and TensorRT LLM requires equivalent model checkpoints, tokenization, generation settings, and hardware resources.
Engine specific features can affect performance. Continuous batching, prefix caching, speculative decoding, and memory allocation strategies all influence the measurements.
I preserve the configuration of each engine in the benchmark report. Without it, a reported performance difference cannot be reliably reproduced or attributed to the tested implementation.
Interpreting Benchmark Results
A benchmark becomes useful when it changes a deployment decision.
Consider two illustrative configurations evaluated against the same workload and service targets.
Configuration A delivers 1,200 output tokens per second, with P95 time to first token reaching 2.1 seconds.
Configuration B delivers 970 output tokens per second, with P95 time to first token remaining at 0.6 seconds.
If the application requires P95 TTFT below one second, Configuration A fails that requirement despite its higher output throughput. Configuration B meets the responsiveness target.
These figures are illustrative, not measured results from a specific system.
The same principle applies to costs. For a fixed workload, compare total deployment cost against completed requests or output tokens delivered within service targets. Include the provisioned infrastructure cost during the measurement period rather than assuming every GPU second produces useful work.
For production decisions, I combine performance, reliability, and cost instead of selecting whichever system leads a single benchmark column.
Benchmark Reporting and Reproducibility
A benchmark report must contain enough information for another engineer to reproduce its conclusions.
Record the model checkpoint, tokenizer, precision, GPU specification, inference engine version, input and output token distributions, cache configuration, sampling parameters, request arrival pattern, concurrency levels, measurement location, test duration, and warmup procedure.
Keep the results of repeated runs separate before summarizing them. This makes measurement variance visible and prevents one favorable run from determining the final comparison.
The final report should identify the maximum tested load that met the specified service targets, the latency distribution at that load, the observed throughput, the failure rate, and the cost of delivering that capacity.
The strongest LLM inference benchmark is not the one with the highest recorded speed. It is the one that identifies a reproducible performance limit under the workload the application actually needs to serve.
FAQ
Can I benchmark an LLM API if I don't know what GPU it's using?
Yes. An API can be evaluated as a complete service without access to its underlying hardware. Use a controlled request dataset and measure externally observable latency, throughput, reliability, and cost. The results support service comparisons but cannot establish the performance characteristics of an undisclosed GPU.
Do hidden reasoning tokens count when I'm benchmarking a reasoning model?
Reasoning tokens contribute to generation work and must be considered when evaluating computational throughput. Use provider reported token usage to identify them when that information is available. For user experience measurements, distinguish the first generated content from the first visible response because these events can occur at different times.
Why am I getting different token speeds from streaming chunks?
A streaming response chunk can contain multiple tokens. The time between chunks is therefore not necessarily the time between individual tokens. Accurate token throughput measurements require matching token counts to the appropriate observation interval. When detailed token timing is unavailable, report client observed throughput and chunk latency separately.
Should I count requests that users cancel before the model finishes?
User initiated cancellations should be tracked separately from completed requests and server failures. Record when cancellation occurs, how many tokens were generated, and how much processing time was consumed. Including cancelled requests as successful completions distorts throughput, while treating every cancellation as a server failure misrepresents reliability.
How do I benchmark an AI agent that calls external tools?
Use two measurement boundaries. The first measures model inference independently, including the generation of tool calls and subsequent model responses. The second measures the complete agent workflow, including external tool execution, network transfers, orchestration, and final response delivery. This separation establishes whether performance delays originate in inference or other components of the application.

Fatemeh Jahangard
Technology & AI Writer at PinerookFatemeh Jahangard covers AI, emerging technologies, and digital innovation for Pinerook, focusing on how technology shapes startups and industries.
 Seen first.