A prediction market may display a 48% probability while offering very few contracts near that price. A small trade might go through without difficulty, yet a larger order could move through several price levels or remain unfilled. That difference is a liquidity problem. It affects what traders pay, how easily they can exit, and how confidently observers should interpret a market price.
Within Prediction Markets, liquidity is the link between a quoted expectation and the orders that support it. The headline number may attract attention, but the available bids and offers determine how much can actually be bought or sold. Understanding that distinction helps traders avoid unexpected execution costs and gives founders a better way to judge whether a market signal deserves a place in a business forecast.
What is prediction market liquidity?
Prediction market liquidity is the ability to buy or sell outcome contracts in meaningful size without causing a large change in the execution price. A liquid market has willing buyers and sellers close to the prevailing quote. An illiquid market may show a reasonable looking probability but offer only a handful of contracts at that price. Liquidity is therefore about present trading capacity, not simply how many people have visited a market or how active it was yesterday.
It helps to separate liquidity from two familiar statistics. Trading volume records contracts or notional value already exchanged over a stated period. Open interest generally tracks contracts that remain outstanding, although definitions and reporting methods vary by venue. Neither figure tells you how many contracts can be executed right now at a specific price. For that, the order book and executable quotations matter more.
Three indicators that reveal whether a market is liquid
Bid and ask spread: the immediate cost of crossing the market
The best bid is the highest currently available price someone offers to pay. The best ask is the lowest currently available price at which someone is willing to sell. Their difference is the spread. If a Yes contract has a bid of 46 cents and an ask of 49 cents, the quoted spread is 3 cents. Someone buying immediately at the ask and then selling immediately at the bid would lose approximately 3 cents per contract before platform fees and any additional price movement.
A narrow spread is usually encouraging, but it is not a complete liquidity test. A market might show a 1 cent spread supported by only 10 available contracts. The quote is attractive for a tiny order but says little about the price of a substantially larger one. Also check how the platform calculates its displayed probability: some use the midpoint between bids and asks under certain conditions, while others may show a recent trade. The display is not necessarily a guaranteed execution price.
Order book depth: how much is actually available
Depth measures the amount of interest resting at each buy or sell price. Suppose 100 Yes contracts are offered at 49 cents, another 200 at 50 cents, and another 200 at 52 cents. Only the first 100 can be purchased at the best ask, assuming those orders remain available when execution occurs. A buyer seeking 500 contracts must either accept higher offers or wait for new sellers. Depth needs to be considered on the relevant side of the market and near the price at which a trade is intended.
Slippage: the gap between a quote and the average fill
Slippage occurs when an order executes at prices less favorable than the initial best quote. In order book markets it can arise when the requested quantity is larger than the available quantity at the best price. A rapid news update or cancellation of resting orders can make the effect worse. Because liquidity is time sensitive, even a snapshot showing substantial depth cannot guarantee that every displayed order will still be available when a trade reaches the market.
A simple example: buying 500 Yes contracts
Consider a hypothetical contract with a best ask of 49 cents. A trader wants 500 Yes contracts and is willing to buy immediately across available offers. The order book contains the quantities shown below. The numbers are illustrative, not current quotes from any platform.
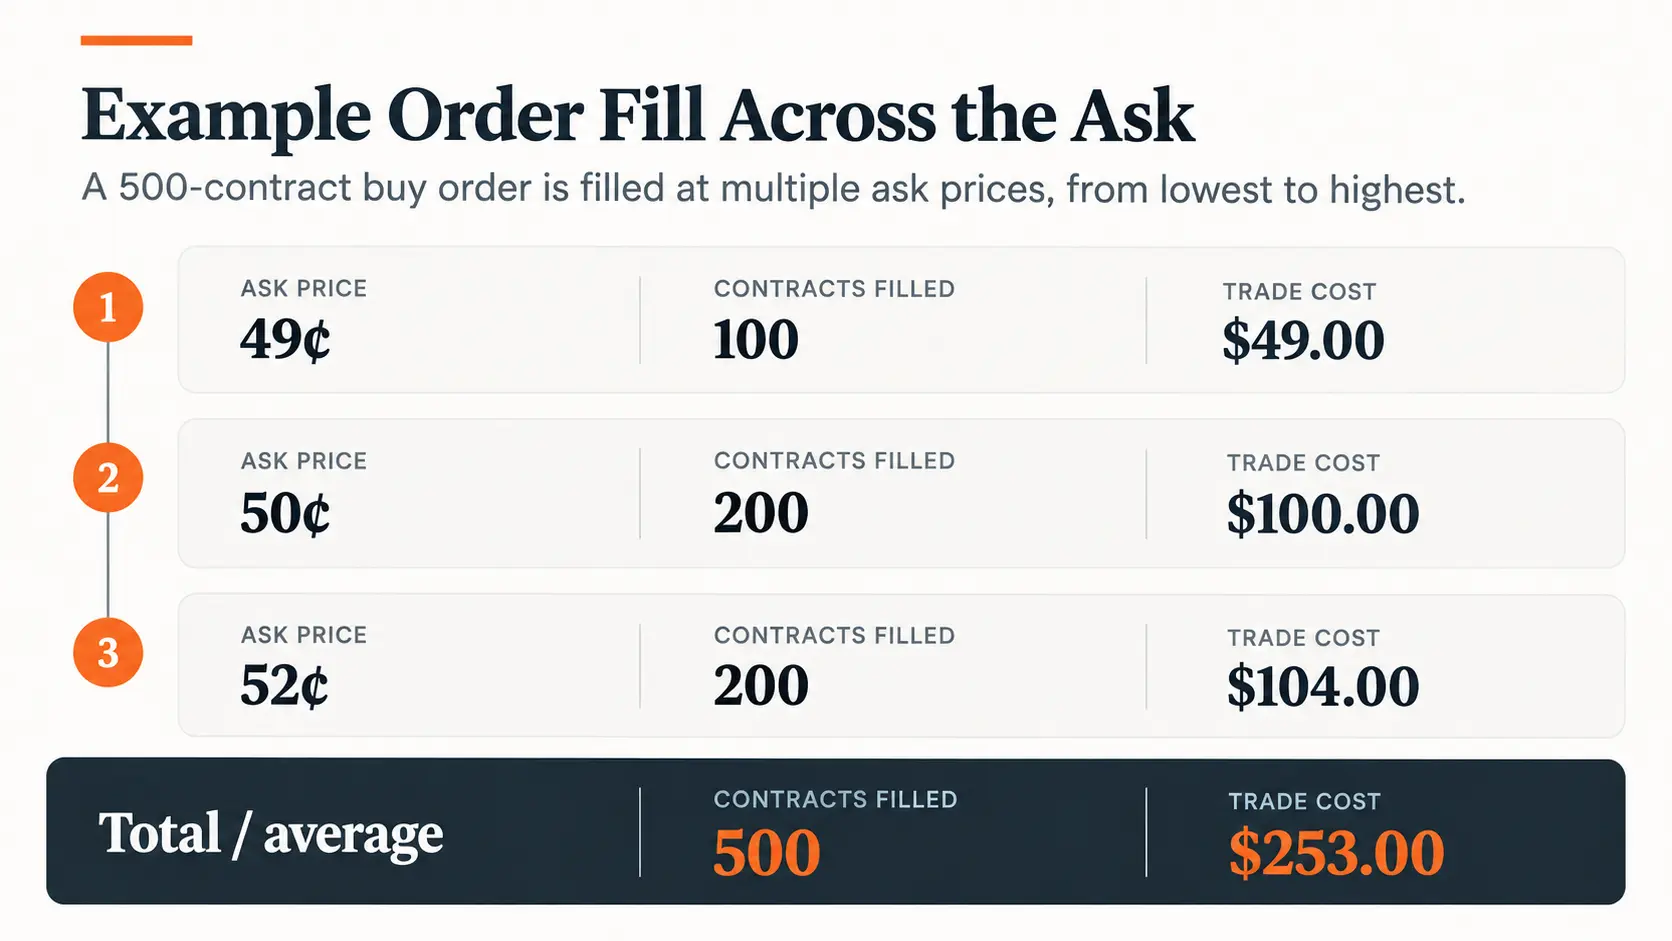
The total cost is $253, making the weighted average purchase price 50.6 cents per contract. Had all 500 contracts been available at the first quoted ask of 49 cents, the cost would have been $245. The extra $8 is the effect of walking up the order book, before fees. This illustration shows why a 49 cent offer does not mean that a trader can acquire any desired quantity at 49 cents.
A limit order that refuses prices above 49 cents would avoid paying more than the stated limit, but it could fill only 100 contracts or none at all if those offers disappear. There is no universally superior order type: the tradeoff is between price control and execution certainty, and the appropriate choice depends on the position and venue rules.
Why high trading volume can conceal poor liquidity
A market can report heavy cumulative volume while being difficult to trade at this moment. Activity may have occurred days earlier, around a news announcement, or at prices far from the current quote. The remaining order book could be sparse even though the market still displays a large lifetime volume figure. Conversely, a relatively new market may have modest historical volume yet maintain competitive two sided quotes during an active trading session.
There is another reason to be cautious: reported volume measures activity, not the diversity of independent views behind it. Repeated trading among a narrow group can make a market look busy without creating durable depth at useful prices. The better question is not “How big is the volume?” but “How much can be traded now, at what average price, and how consistently does that capacity return?”
When liquidity changes most sharply
Liquidity is not fixed throughout a contract’s life. Early trading may be thin because few participants have studied the event or because its outcome remains distant. Depth can grow as news coverage expands, only to vanish briefly when a major announcement changes expectations. Near resolution, certain contracts may become easier to price but less attractive for market makers to quote if the remaining payout is small relative to operational and information risks.
A sudden price move therefore deserves two separate questions. Did new evidence change the estimated probability, or did a relatively small trade move through a thin book? Both can happen at the same time. Reviewing recent executed trades alongside the current bid, ask, and size helps distinguish an information driven repricing from a quotation that moved because the market could not absorb an order.
Who supplies liquidity, and why?
Market makers and other participants add liquidity by posting limit orders that others may trade against. In return, they may seek to earn the spread, receive venue incentives, or manage exposure across related outcomes. Those orders create opportunities for immediate trading, but providers can adjust or cancel quotes as the expected risk changes. A quoted price should never be treated as permanent inventory.
Some prediction market platforms offer liquidity rewards or maker rebates to encourage tighter spreads and deeper books. Polymarket, for example, documents programs that reward eligible resting orders or maker activity under specific rules. These incentives can help trading conditions, but they do not guarantee continuous liquidity, genuine forecast accuracy, or profitable market making. Terms differ by market, platform, and date.
A practical liquidity check before acting on a market price
Check the price you can trade, not just the headline percentage
Find the live bid and ask on the side relevant to the proposed trade. Note whether the market display represents a midpoint, a recent trade, or an executable offer. A displayed 48% probability and a best ask of 52 cents describe different prices with different uses.
Check depth at your intended size
Look beyond the first quoted level. Compare the number of contracts available near the best ask or bid with the quantity you would actually need. If reaching that size requires crossing several levels, calculate the weighted average execution price and consider what happens if the book changes during execution.
Check whether trading activity is current
Compare recent fills, spreads, and resting order sizes with the cumulative volume metric. A market that was active last week but has barely traded since the latest news may not provide a competitive price today. Check both sides of the book, because ample buying interest does not necessarily imply ample selling interest.
Check the event rules and the limits of the signal
Before treating a contract as a forecast, verify the exact resolution conditions and deadline. Good liquidity does not correct an ambiguous contract or compensate for a market populated by people following the same unverified claim. A robust forecast assessment combines trading quality with the event definition and independent evidence.
What liquidity means for founders and analysts
A founder watching a prediction market on interest rates, economic policy, or an industry outcome may never place a trade. Liquidity still matters. If a market’s apparent 65% forecast is supported by a wide spread and little active depth, that number should receive less weight in a strategic discussion than a frequently updated quote backed by competitive orders. Neither figure is a substitute for the company’s own scenarios.
Consider a startup planning its hiring runway around the likelihood of a central bank rate decision. Market prices might help the team choose which scenarios deserve closer attention, but the downside budget should not disappear because a contract implies a low probability. The useful decision is to compare the observed market signal, its liquidity, official data, and the business impact of being wrong.
FAQ
Does higher volume always mean better prediction market liquidity?
No. Volume records past trading, while liquidity concerns the orders and prices available now. A heavily traded market can still have a thin order book at the moment you want to buy or sell.
Can a prediction market have a tight spread but low liquidity?
Yes. A 1 cent spread may be supported by only a few contracts. A larger order may immediately reach worse prices, so a narrow spread should always be considered alongside executable depth.
How is liquidity different from market accuracy?
Liquidity describes ease of trading and the market’s ability to absorb orders. Accuracy describes how closely forecast probabilities match outcomes across many events. Liquidity can support price discovery, but a liquid market can still be wrong.
Can a limit order eliminate slippage?
A buy limit order caps the price paid per contract, and a sell limit order sets a minimum acceptable sale price. It cannot guarantee a complete or immediate fill. Orders may execute partially, remain open, or be canceled under the venue’s rules.
Prediction market liquidity is ultimately about the quality of executable prices. Spreads show the cost of immediate trading, depth shows available capacity, and slippage reveals what happens when an order exceeds the best quoted quantity. Reading all three makes market prices more useful, whether the goal is to trade a contract or interpret a probability for a business decision.

Masoumeh Jahangard
Markets & Economy Writer at PinerookMasoumeh Jahangard covers markets, economic trends, and business conditions for Pinerook, focusing on how they affect startups and growing companies.
 Seen first.